- Original Paper
- Open access
- Published:
A strategy for preparing software organizations for statistical process control
Journal of the Brazilian Computer Society volume 19, pages 445–473 (2013)
Abstract
Software organizations have increased their interest in software process improvement (SPI). Nowadays, there are several frameworks that support SPI implementation. Some of them, such as CMMI (Capability Maturity Model Integration), propose to implement SPI in levels. At high maturity levels, such as CMMI levels 4 and 5, SPI involves carrying out statistical process control (SPC), which requires measures and data suitable for this context. However, measurement problems have been pointed in the literature as one of the main obstacles for a successful implementation of SPC in SPI efforts. With this scenario in mind, we developed a strategy to help software organizations prepare themselves regarding measurement aspects in order to implement SPC. The strategy is made up of three components: a Reference Software Measurement Ontology, an Instrument for Evaluating the Suitability of a Measurement Repository for SPC, and a Body of Recommendations for Software Measurement Suitable for SPC. In this paper we present the strategy as a whole and describe each one of its components.
1 Introduction
Statistical process control (SPC) was originally developed in the manufacturing area, aiming to support improvement programs. In the context of software organizations, the use of SPC can be considered recent, so there are still many doubts about it [1, 2]. Real cases of SPC implementation in software organizations have revealed a picture characterized by problems and situations that affect the successful implementation of SPC. The unsuitability of the defined measures and collected data is one of the main problems [3]. It delays SPC implementation because the measures should be firstly corrected and then to only apply SPC techniques.
At high maturity levels, such as CMMI (Capability Maturity Model Integration) [4] levels 4 and 5, or MR MPS.BR (Reference Model for Brazilian Software Process Improvement) [5] levels A and B, SPC occurs after a measurement program has been institutionalized (a requirement of CMMI level 2 and MPS.BR level F). As a result of the measurement program, measures and data are stored in an organizational measurement repository [6]. It is expected that these measures and data are suitable to be used in SPC. However, as it was said before, usually this is not the case.
Considering that, we defined a strategy to support organizations that desire to achieve high maturity levels to obtain and maintain measurement repositories suitable for SPC as well as to perform measurements appropriately for this context. The strategy has three components: a Reference Software Measurement Ontology (RSMO), an Instrument for Evaluating the Suitability of a Measurement Repository for SPC (IESMR), and a Body of Recommendations for Software Measurement Suitable for SPC (BRSM).
At the beginning of our work, we performed a literature systematic review (SRL) with the purpose of identifying software measurement related factors that positively or negatively influence SPC implementation. Based on these factors, we defined a set of requirements for a measure to be used in SPC. These requirements, in turn, were arranged in the form of checklists that comprise the Instrument for Evaluating the Suitability of a Measurement Repository for SPC (IESMR). The IESMR includes checklists for evaluating four items related to measurement: the measurement plan, the measurement repository structure, the measures defined, and the data collected for the measures. The IESMR provides procedures for evaluating each requirement and the possible corrective actions to be taken when a requirement is not satisfied.
When we were defining the IESMR, we identified the need for establishing a common conceptualization regarding the software measurement domain that includes also aspects related to measurement in high maturity organizations. This need gave rise to the Reference Software Measurement Ontology (RSMO). The RSMO is a domain reference ontology grounded in the Unified Foundational Ontology (UFO) [7, 8]. It was developed following the Systematic Approach for Building Ontologies (SABiO) [9], which prescribes an ontology development process comprising activities for purpose identification, ontology capture, ontology formalization, integration with existing ontologies, ontology evaluation, and ontology documentation. The RSMO was developed with the purpose of providing a common vocabulary and relevant knowledge about the software measurement domain, including traditional and high maturity measurement aspects. As for ontology capture, RSMO is based on several standards (such as CMMI [4], ISO/IEC 15939 [10], PSM [11], and IEEE Std. 1061 [12]), and on high maturity software measurement aspects. Several axioms were defined and formalized in first-order logics, describing constraints in the software measurement domain. Since the software measurement domain is strongly related to the domains of software processes and organizations, RSMO reuses part of the conceptualization described in a software process ontology [8] and a software organization ontology [13]. Finally, ontology evaluation was done by means of verification and validation (V&V) activities. For verifying the ontology, we checked if the concepts, relations and axioms were able to satisfy the ontology requirements. For validating the ontology, we instantiated the RSMO’s elements with real entities extracted from measurement repositories of organizations, in order to verify if the ontology was able to represent concrete situations of the real world.
Finally, to complement our strategy, we defined a practical guide to organizations to perform software measurement suitable for SPC: the Body of Recommendations for Software Measurement Suitable for SPC (BRSM). The BRSM is composed by recommendations related to eighteen aspects organized in five groups, namely: (i) recommendations related to software measurement preparation, (ii) recommendations related to the alignment between software measurement and organizational goals, (iii)recommendations related to the definition of software measures, (iv) recommendations related to the execution of software measurement, and (v) recommendations related to software measurement analysis.
There are two main scenarios in which software organizations that are interested in using SPC can apply the strategy presented in this paper. In the first one, an organization that has already a measurement repository can use the IESMR component in order to evaluate and adapt, when possible, their measurement repositories for SPC. In the second scenario, an organization that is starting to implement an SPI program can use the knowledge provided by the RSMO and the recommendations provided by the BRSM for building a measurement repository, elaborating a Measurement Plan and carrying out measurements suitable for SPC.
The purpose of this paper is to present the strategy as a whole. In this sense, details of each component are not presented in this paper. Contrariwise, here we present only the most important information regarding the strategy, taking the perspective of software quality practitioners into account. Thus, regarding the RSMO, we present the conceptual models and the definitions of the terms adopted. Axioms and tables exemplifying how we performed ontology V&V are presented only to illustrate how we performed the corresponding activities. A discussion on the fact that RSMO be grounded in UFO is out of the scope of this paper. For more detailed information about these aspects, the reader should see [14–18]. With respect to the IESMR, we present the four checklists developed, along with instructions about how to apply them. Suggested actions for suitability are only illustrated. Details regarding the IESMR can be found in [19]. Finally, concerning the BRSM, we enumerate each aspect addressed in each one of the groups before mentioned, and we present some recommendations as examples. Also, we briefly discuss how we preliminarily evaluated the BRSM.
Since the strategy is very extensive, we have published fragments of its components in [14–19]. However, the strategy as a whole has not been published yet, as well as information regarding the BRSM. Also, in this paper we include parts of the RSMO not shown in previous publications and we present RSMO under a different point of view, focusing on the domain rather than on ontological aspects, as we did in previous publications [14–18].
This paper is organized as follows: Sect. 2 briefly discusses software measurement and statistical process control; Sect. 3 presents the main results of a study based on systematic review that analyzed aspects related to software measurement that influence SPC implementation; Sect. 4 presents the strategy and its components; Sect. 5 discusses some related works; and, finally, in Sect. 6 we present our final considerations and future work.
2 Software measurement and statistical process control
There are several standards and models that support software process improvement (SPI), such as ISO/IEC 12207 [20], ISO/IEC 15504 [21], CMMI [4], and MR MPS.BR [5], and almost all of them include software measurement as an essential process for organizations to achieve maturity in software development.
For performing software measurement, initially, an organization must plan it. Based on its goals, the organization has to define which entities (processes, projects, products and so on) to consider for software measurement and which of their properties (size, cost, time, etc.) are to be measured. The organization has also to define which measures are to be used to quantify those elements. Measures can be base measures, i.e., measures that are functionally independent of other measures, or derived measures, which are defined as a function of other measures. For each measure, an operational definition should be specified, indicating, among others, how the measure must be collected and analyzed. Once planned, measurement can start. Measurement execution involves collecting data for the defined measures according to their operational definitions. Once data are collected, they should be analyzed, also following the guidelines established by the corresponding operational definitions. Finally, the measurement process and its products should be evaluated in order to identify potential improvements [16, 17].
Depending on the organization’s maturity level, software measurement is performed in different ways. At initial levels, traditional measurement consists basically in collecting data from projects and comparing them with their corresponding planned values. At high maturity levels, traditional measurement is not enough. It is necessary to carry out statistical process control in order to know the processes behavior, determine their performance in previous executions, and predict their performance in current and future projects; verifying if they are able to achieve the established goals [4, 22]. The SPC uses a set of statistical techniques to determine if a process is under control, considering the statistical point of view. A process is under control if its behavior is stable, i.e., if their variations are within the expected limits, calculated from historical data [22]. The behavior of a process is described by data collected for performance measures defined by this process.
A process under control is a stable process and, as such, has repeatable behavior [22]. So, it is possible to predict its performance in future executions and, thus, to prepare achievable plans and to improve the process continuously. On the other hand, a process that varies beyond the expected limits is an unstable process [22] and the causes of these variations (said special causes) must be investigated and addressed by improvement actions, in order to stabilize the process. Once the processes are stable, their levels of variation can be established and sustained, it being possible to predict their results. Thus, it is also possible to identify the processes that are capable of achieving the established goals and the processes that are failing in meeting the goals. In this case, actions to change the process in order to make it capable should be carried out [22]. Stabilizing their critical processes is a characteristic of high maturity organizations or organizations that are looking forward to achieve the highest maturity levels.
Figure 1 summarizes the process behavior analysis using SPC principles. First, it is necessary to understand the organizational business goals. Next, the processes related to business goals are identified and the measures used to provide quantitative information about their performance are identified. Data for the measures are collected, checked, stored and used for analyzing the processes behavior using statistical techniques. If a process is unstable, the special causes should be removed. If it is incapable, it should be changed. Finally, if it is capable, it can be improved continuously.

Process behavior analysis (adapted from [22])
3 Software measurement related factors that impact on SPC: a literature systematic review
As said before, measurement problems have been pointed in the literature as one of the main obstacles for a successful implementation of SPC in SPI efforts. Aiming at systematically analyzing the influence of software measurement on SPC implementation, we carried out a study based on a systematic review of the literature. The purpose of this study was to identify and analyze: \((i)\) software measurement related factors that positively influence SPC implementation, and (ii) software measurement related factors that negatively influence SPC implementation.
The study was performed following the process defined by the Software Quality Group from the Federal University of Rio de Janeiro [23] based on [24]. The process is made up of three steps:
-
(i)
Develop Research Protocol: In this step the researcher prospects the topic of interest, defines the context to be considered in the study, and describes the object of analysis. Next, he/she defines the research protocol that will be used to perform the research. The protocol must contain all the necessary information for a researcher to perform the research: research questions, sources to be searched, selection criteria, procedures for result storage and analysis, and so on. The protocol must be tested in order to verify its feasibility, i.e., if the results obtained are satisfactory and if the protocol execution is viable in terms of time and effort. The test results allow for improving the protocol when necessary. If the protocol is viable, an expert must evaluate it and once approved, the protocol can be used to conduct the research.
-
(ii)
Perform Research: In this step the researcher performs the research according to the defined protocol. Publications are selected, and data are extracted, stored, and quantitatively and qualitatively analyzed.
-
(iii)
Provide Results: In this step the research results produced during the execution of the systematic review process are packaged and should be published.
The research protocol defined in this study contains the following information: objective, research questions, electronic source selection criteria, publication inclusion/ exclusion criteria, data extraction and storage procedure, analysis procedure, and protocol test procedure.
It is worthwhile to point out that the purpose of this paper is to present our strategy for preparing software organizations to implement SPC. Thus, detailed information regarding the literature systematic review performed to elicit the requirements for the strategy is out of the scope of this paper. In this section we only present the procedure for selecting publications used and the final results of the study. For more details, see [25].
The procedure for selecting publications was performed in three steps. The first one, called S1-Preliminary Selection and Cataloging, selected publications by applying the following criteria using the digital library search:
Date: from 1990, January 1st
Language: English
Search string: ((“statistical process control”) AND (“measurement” OR “measures” OR “metrics”) AND (“problems” OR “questions” OR “factors” OR “requirements” OR “characteristics” OR “needs” OR “difficulties” OR “guidelines” OR “strategies” OR “strategy” OR “lessons learned” OR “best practices”) AND (“software”)).
Areas: Computer Science and Engineering
The electronic sources searched were: Compendex, Scopus, IEEE, and Science Direct (limited to the Journal of Systems and Software, the Journal of System Architecture, and the Information and Software Technology).
Since a search using an expression is limited to syntactic aspects, it is probable that some selected publications do not contain relevant information to the study. For that reason, a second step (called S2—Relevant Publications Selection—-First Filter), composed by criteria regarding the publication abstract, was applied to the publications selected in the first step, in order to identify that ones whose abstracts showed signs that the publication addresses the research questions. In S2, the abstract of each publication selected in S1 was analyzed and the publications that did not satisfy one or both the following criteria were eliminated:
-
C1.
The publication presents results from studies involving SPC or measurement (directly or indirectly related to SPC).
-
C2.
The publication presents useful information in the context of measurement or SPC for software processes.
Aiming to avoid premature exclusions of publications, we did not eliminate any publication in case of doubt. Also, publications without an abstract were not eliminated.
Considering that in the second step only the publication abstract was read, it is still possible that useless publications have been selected. Then, the last step (called S3—Relevant Publications Selection—Second Filter), composed by criteria regarding the publication content, was performed to select among the publications selected in S2, those ones that answer the study research questions. In S3, the full text of publications selected in S2 was read and the publications that did not satisfy one or both the following criteria were eliminated:
-
C3.
The publication provides information concerning factors related to software measurement that influence SPC implementation (for example, measurement problems or good practices).
-
C4.
The full text of the publication is available.
Then 212 publications were selected in the first step, 87 in the second, and 30 in the third. As a result, we obtained a list of measurement related factors that positively influence SPC implementation and a list of measurement related factors that negatively influence SPC implementation. These lists are presented in Tables 1 and 2, respectively.
It is important to notice that several factors identified in the study are not related to measurement at high maturity levels, but to measurement in general (e.g., N11, N15, and N20, among others). It means that several problems related to measurement at high maturity levels usually have an origin at initial levels. Since the impacts of some problems are stronger in the context of SPC than in traditional measurement, they are only recognized when organizations start the practices to implement SPC. For instance, regarding N20, incorrect data must be removed from the group of values being analyzed for a measure. Since software process behavior analysis using SPC considers chronological aspects, when sequential data are removed from the data group being plotted in a control chart, it is possible that the process behavior obtained is different from the actual process behavior. In other words, the behavior analysis can be compromised.
The knowledge obtained from the study was used to help us in the definition of our strategy. The strategy and its components are presented in the next section.
4 A strategy for preparing software organizations for SPC
The strategy developed in this work is made up of three components: the Reference Software Measurement Ontology (RSMO), which provides a common vocabulary and relevant knowledge about the software measurement domain, including traditional and high maturity measurement aspects; the Instrument for Evaluating the Suitability of a Measurement Repository for SPC (IESMR), which is used to evaluate existing measurement repositories and to determine their suitability for SPC, identifying corrective actions that can be taken as a means to obtain measurement repositories suitable for SPC (if it is necessary and possible); and the Body of Recommendations for Software Measurement Suitable for SPC (BRSM), which provides guidelines on how to prepare a measurement program, to define measures and to perform measurements suitable for SPC.
Software organizations that are interested in using SPC are generally in one of two scenarios. In the first one, there are organizations that have achieved the initial maturity levels and wish to use the measures and data collected along those levels in SPC. In the second one, there are organizations that are starting a SPI program and intend, since the initial levels, to build a measurement repository and perform measurement suitable for SPC. The strategy proposed can be used in both scenarios.
Organizations that have already a measurement repository can use, as a reactive approach, the IESMR component in order to evaluate and adapt, when possible, their measurement repositories for SPC. On the other hand, as a pro-active approach, organizations that are starting SPI programs can use the knowledge provided by the RSMO and the recommendations provided by the BRSM for building a measurement repository, elaborating a Measurement Plan and carrying out measurements suitable for SPC.
Since an organization starts SPC, new data will be collected and, probably, new measures will be defined. Therefore, the strategy can be used continuously, aiming to maintain the suitability of the measurement repository for SPC. In other words, organizations can continuously use the RSMO and the BRSM as sources of knowledge for defining new measures and carrying out measurements, and they can also use the IESMR as a support for evaluating the measurement repository, when it is changed. In the following, the components of the strategy are presented.
4.1 The reference software measurement ontology
When we started to work on the strategy, we noticed that we needed a common vocabulary about software measurement to make explicit the conceptualization to be used. Thus, we looked at standards and methodologies devoted specifically to assist organizations in defining their software measurement process, such as ISO/IEC 15939 [10] and PSM (Practical Software Measurement) [11]. These standards provide some definitions for measurement related terms that are commonly used by the software industry. Unfortunately, the vocabulary used by those standards, and, as a consequence, by the software organizations, is diverse. Many times, the same concept is designated by different terms in different proposals. Other times, the same term refers to different concepts. To deal with these problems, it is important to establish a common conceptualization regarding the software measurement domain.
In this context, a domain ontology can be used for human communication, promoting common understanding among knowledge workers [26]. In fact, we were interested in a domain reference ontology, i.e., a domain ontology that is constructed with the sole objective of making the best possible description of the domain in reality, with regard to a certain level of granularity and viewpoint [27]. A domain reference ontology is a special kind of conceptual model, representing a model of consensus within a community. It is a solution-independent specification, with the aim of making a clear and precise description of domain entities for the purposes of communication, learning and problem-solving. Ideally, a reference ontology should be built based on fundamental ontological distinctions, given by a foundational ontology [7, 28].
Thus, we looked for software measurement ontologies proposed in the literature. There are some initiatives committed with ontology-based modeling and formalization of the software measurement domain, among them the ones proposed in [29, 30]. However, as a rule, such initiatives are not committed to the use of a foundational ontology as their basis. Besides, they do not address measurement in high maturity aspects, which involve statistical process control.
For the reasons just mentioned, we developed a Reference Software Measurement Ontology (RSMO), which is a domain reference ontology built based on the Unified Foundational Ontology (UFO) [7, 8], on the vocabulary used in several standards (such as CMMI [4], ISO/IEC 15939 [10], PSM [11], and IEEE Std. 1061 [12]), on high maturity software measurement aspects, and on the results of the study based on a systematic review of literature presented in Sect. 3.
For developing the Reference Software Measurement Ontology (RSMO), we used SABiO (Systematic Approach for Building Ontologies) [9]. This method has been used for the last ten years in the development of a number of domain ontologies in areas ranging from Harbor Management to Software Process to the Electrocardiogram domain. SABiO prescribes an iterative process comprising the following activities: (i) purpose identification and requirement specification that is concerned about clearly identifying the ontology purpose and its intended uses, i.e., the competence of the ontology by means of competency questionsFootnote 1; (ii) ontology capture, when relevant concepts, relations, properties and constraints are identified and organized; (iii) ontology formalization, which comprises the definition of formal axioms in First-Order Logic; (iv) integration of existing ontologies, which involves searching for existing ontologies that can be reused; (v) ontology evaluation, for identifying inconsistencies as well as verifying the truthfulness with the ontology’s purpose; and (vi) ontology documentation.
Since the software measurement domain is strongly related to the domains of software processes and organizations, we reused the software process ontology described in [8] and the software organization ontology proposed in [13]. This ontology, however, was not developed grounded in a foundational ontology. Thus, we had to reengineer it before using it. The reengineered ontology was published in [14].
The RSMO is composed of six sub-ontologies: the Measurable Entities & Measures sub-ontology, which is the core of the RSMO, treating the entities that can be submitted to measurement, their properties that can be measured, and the measures used to measure them; the Measurement Goals sub-ontology that deals with the alignment of measurement to organizational goals; the Operational Definition of Measures sub-ontology, which addresses the detailed definition of operational aspects of measures, including data collection and analysis; the Software Measurement sub-ontology that refers to the measurement per se, i.e., collecting and storing data for measures; the Measurement Analysis sub-ontology, handling the analysis of the collected data for getting information to support decision making; and finally, the Software Process Behavior sub-ontology, which refers to applying measurement results in the analysis of the behavior of organizational software processes.
Figure 2 shows the RSMO sub-ontologies and the integrated ontologies as UML packages, and their relationships as dependency relationships. In the figure, the dependency relationships indicate that concepts and relations from a sub-ontology/ontology are used by another.

RSMO overview
For each one of the RSMO sub-ontologies we accomplished the steps of SABiO. As a result, the RSMO ontology is made of: (i) sets of competency questions, describing the sub-ontologies requirements specification; (ii) structural conceptual models represented as UML class diagrams, capturing the concepts and relations of the sub-ontologies; (iii) a dictionary of terms, providing descriptions for each term in the ontology in natural language; and (iv) first order logic axioms, capturing constraints that are not captured by the conceptual models developed. Aiming to help organizations understand the RSMO conceptualization, even for those not very familiar with conceptual models and axioms, we also elaborated textual explanations about the concepts, relationships and axioms, including examples based on practical measurement experiences.
The RSMO is very extensive. In this paper we present the content we consider more relevant to understanding the strategy as a whole. Thus, some fragments of RSMO conceptual models and the corresponding textual description of their concepts are presented here. Detailed descriptions containing competency questions, axioms, the RSMO evaluation and discussions about the use of UFO as a basis for RSMO can be found in [15–17].
Since RSMO is a reference ontology, we modeled it using a UML profile based on UFO. This profile commits to a much richer meta-ontology than the ones underlying languages designed to maintain interesting computational properties such as tractability and decidability, like OWL [27]. These computational properties are in general absent in more expressive languages, such as the UML profile we adopted and, thus, the evaluation of RSMO was made manually. For each competency question, we related the concepts, relations and axioms used to answer it, and, aiming at a minimum ontological commitment, we verified if the ontology has only the concepts, axioms and relations needed to answer the competency questions. Besides, in order to verify if RSMO is able to represent concrete situations of the real world, we instantiated it with real entities extracted from measurement repositories of organizations.
Next, some fragments of the RSMO sub-ontologies are presented. In each sub-ontology conceptual model, the concepts from other (sub-) ontologies are identified preceded by the following abbreviations: SOO—Software Organization Ontology; SPO—Software Process Ontology [8]; MEM—Measurable Entities & Measures sub-ontology; MGO—Measurement Goals Sub-ontology; ODM—Operational Definition of Measure Sub-ontology; MEA—Measurement Sub-ontology; MAN—Measurement Analysis Sub-ontology; and SPB—Software Process Behavior Sub-ontology. Aiming not to visually overload the diagrams, the stereotypes of the UFO-based UML profile we used are not shown. Also some specializations and relationships presented in a diagram are not shown in the subsequent diagrams. For the MEM sub-ontology, as an example, we present some of its competency questions and a fragment of its evaluation.
After each conceptual model, the concepts presented are described. In the text, the first occurrences of RSMO concepts are shown in bold and instances of RSMO concepts are shown underlined.
It is worthwhile to point out that most of the concepts in RSMO have a correspondent in the standards and models that we used as a basis for developing the ontology. However, some of them do not have a counterpart; they were included in RSMO due to ontological distinctions given by UFO or in order to generalize concepts established in the standards. Obviously, many times the terms used to designate the concepts in RSMO are also distinct from the terms used in the standards and models, since the vocabulary used by these standards and models is diverse. Finally, the definitions we gave for the RSMO concepts were based on the definitions given by the standards and models we used as the basis during ontology capture. However, they are not exactly the same. Sometimes, we combined different definitions from different standards and models, achieving a new definition; other times, we used the conceptualization underlying UFO to improve a definition given by a standard or model. Thus, although in general there is a correspondence between the concepts in RSMO and the terms adopted by the standards and models, their definitions are not exactly the same. Table 3 shows a mapping between some RSMO concepts and the corresponding terms used by the standards and models. We prefer to follow this approach, since we do not want to commit to any particular standard or model. Moreover, acting in this way, we feel freer to use the RSMO to harmonize different standards and models.
4.1.1 The measurable entities and measures sub-ontology
This sub-ontology is the core of the RSMO and its concepts are used by all the others RSMO sub-ontologies. It regards elements of entities (such as processes, projects, artifacts and so on) that can be measured and the measures used to measure them. Figure 3 shows its conceptual model. Some of the competence questions this sub-ontology should be able to answer are:
-
CQ1.
What is the type of a measurable entity?
-
CQ2.
Which are the measurable elements that characterize all measurable entities of a same type?
-
CQ3.
Which are the measurable elements of a measurable entity?
-
CQ4.
Which measures can be used to quantify a measurable element?
Fig. 3 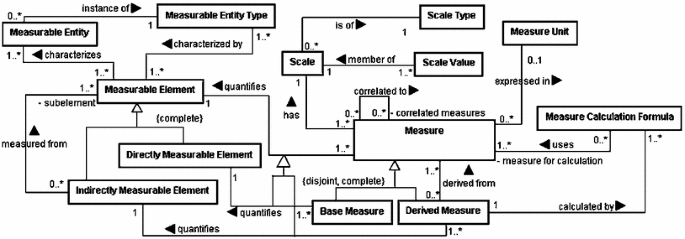
Fragment of the Measurable Entities and Measures Sub-ontology

A Measurable Entity is anything that can be measured, such as a process, an artifact, a project and a resource [10–12]. Measurable entities can be classified according to types (Measurable Entity Type). For instance, process is a type of measurable entity.
Measurable Entities are characterized by Measurable Elements. A Measurable Element is a property of a Measurable Entity that can be distinguished, and, thus, measured [10–12]. Size and productivity are examples of measurable elements. Measurable Elements can be directly (e.g., size) or indirectly (e.g., productivity) measured. Indirectly Measurable Elements are measured by means of other measurable elements, said to be their sub-elements.
Measurable Entities that are instance of the same Measurable Entity Type are characterized by the same Measurable Elements. The axiom MEM-A1 captures this constraint\(.\)
MEM-A1: (\(\forall \)men\(\epsilon \)MeasurableEntity,t\(\epsilon \)MeasurableEntityType, mel\(\epsilon \)MeasurableElement)(instanceOf(men,t)\(\wedge \)characterizes(mel,t)\(\rightarrow \)characterizes(mel,men))
A Measure is an instrument that allows associating Measurable Elements with ScaleValues of a Scale [7, 10–12]. For instance, the measure number of requirements can be used to associate a value to the measurable element size that characterizes the measurable entity type project. Thus, a Measure quantifies a Measurable Element and has a Scale composed by Scale Values. Moreover, a Scale is of a Scale Type [10, 11] (e.g., absolute, nominal).
A measure can be correlated to other measures, said its correlated measures, indicating, for instance, that they are related to the same goal, or that they have a cause-effect relationship [11]. Finally, Measures can be classified into Base Measures, which are functionally independent of other measures (e.g., number of requirements) and used to quantify Directly Measurable Elements, and Derived Measures (e.g., requirements changing rate, given by the ratio of the number of changed requirements to the number of requirements), which are defined as a function of other measures and used to quantify Indirectly Measurable Elements [4, 10, 11].
A Measure can be expressed in a Measure Unit [4],[10–12] (e.g., hours, function points). Derived Measures are calculated by Measure Calculation Formulas, which, in turn, use other measures as measures for calculation [10, 11].
As said before, the RSMO concepts were obtained by analyzing terms used in several proposals, standards and models that address software measurement. Table 3 presents, as an example, the mapping between the concepts shown in Fig. 2 and the terms used in some standards/models. It is important to point out that some of the RSMO concepts are not present in any standard/model. They were included in RSMO aiming to better represent the conceptualization of the software measurement domain. The use of a foundational ontology (UFO) as a basis for developing RSMO helped us to identify several of these concepts, by means of disambiguating concepts when they were analyzed in the light of UFO. Some discussions regarding how UFO helped us to develop our RSMO can be found in [15–17].
During the development of the RSMO, several constraints were identified and, since the conceptual models are not capable of capturing several of them, we defined axioms to make them explicit. As said in Sect. 1, these axioms are not the focus of this paper, and, thus, only some of them are presented, such as the axiom MEM-A1, previously presented. For details, see [15–17]. Moreover, as also discussed in Sect. 1, we performed activities for verifying and validating the ontology, which are not the focus of this paper yet. In order to illustrate how we performed these activities, Tables 3 and 4 show examples regarding ontology verification and validation. For more details, see [15–17].
The RSMO evaluation started with a verification activity, where we checked if the concepts, relations and axioms were able to answer the competency questions. Table 4 shows a small fragment of the table used for verifying the MEM sub-ontology, considering the competency question CQ3.
For validating the ontology, we instantiated the RSMO concepts with real elements extracted from measurement repositories of organizations, in order to check if the ontology was able to represent concrete situations of the real world. Table 5 shows part of an instantiation of the MEM sub-ontology.
4.1.2 The measurement goals sub-ontology
Measurement should be aligned to organizational goals in order to produce useful data for decision-making, goals monitoring, activities management and process performance analysis. The Measurement Goals sub-ontology addresses concepts, relationships and constraints related to the alignment between measurement and goals. Figure 4 shows its conceptual model.

Fragment of the Measurement Goals Sub-ontology
An Intention is the purpose for which actions are planned and performed in an Organization [7]. A Goal is the propositional content of an Intention [7]. In the context of software measurement, a goal can be a Business Goal, a Software Goal or a Measurement Goal. A Business Goal expresses the intention for which strategic actions are planned and performed (e.g., increase 10% the number of clients) [4, 7, 22]. A Software Goal expresses the intention for which actions related to the software area are planned and performed (e.g., achieve the CMMI level 4). A Measurement Goal expresses the intention for which actions related to software measurement are planned and performed (e.g., stabilize the behavior of the critical processes) [4, 32]. Software and measurement goals are defined based on business goals. Measurement goals can also be defined from software goals. A Measurement Goal can be a Project Monitoring and Control Measurement Goal (e.g., improve the adherenceto projects plans), a Quality Measurement Goal (e.g., reduce the number of delivered defects) or a Performance Measurement Goal (e.g., stabilize the behavior of the criticalprocesses) [4].
Concerning goals, we should state that if a measurement goal mg is defined based on the software goal sg and sg is defined based on the business goal bg, then mg is also defined based on bg.
MGO-A1: (\(\forall \) mg \(\epsilon \) Measurement Goal, sg \(\epsilon \) Software Goal, bg \(\epsilon \) Business Goal) (isDefinedBasedOn (mg, sg) \(\wedge \) isDefinedBasedOn (sg, bg) \(\rightarrow \) isDefinedBasedOn (mg, bg))
Information Needs are identified from goals and they are satisfied by Measures . For instance, the measurement goal improve the adherence to projects plans could identify the information need know the requirements stability after theirapproval by the client, which could be satisfied by the measure requirements changing rate [4, 10–12].
Measures can be used to indicate the achievement of goals. In this case, the measure fulfills the role of an Indicator [10, 11]. Considering the example cited above, if the measure requirements changing rate is used for monitoring the achievement of the goal improve the adherence to projectsplans, then, in this context, it is an indicator. Thus, the following constraint holds: if a measure \(m \)is an indicator of the achievement of the goal \(g, \)then there should exist an information need in, identified from the goal \(g, \)which is satisfied by \(m.\)
MGO-A2: (\(\forall \)m\(\epsilon \) Indicator, g\(\epsilon \)Goal) (indicatesAchievementOf(m,g)\(\rightarrow \) (\(\exists \)in\(\epsilon \)Information Need) (identifies(g,in)\(\wedge \)(satisfies(m, in))
4.1.3 The operational definition of measures sub-ontology
An operational definition of measure regards defining in details how a measure must be collected and analyzed according to its intended use. For instance, measures used at high maturity levels for analyzing process performance must apply statistical process control techniques. Thus, their operational definitions should include such techniques as procedures for analyzing collected data. This is not the case for measures used at initial maturity levels, where their intended use is to support traditional project monitoring and control.
Measurement repeatability is related to the accuracy and completeness of the operational definitions applied. If an operational definition of measure is imprecise, ambiguous or poorly documented, probably different people will understand the measure in different ways. As a consequence, it is likely that they collect invalid data, perform incomparable measurements or incorrect analysis, making the measurement inconsistent and inefficient [33].
At high maturity levels, measurement data are used for statistical process control, and in this context, the quality of the operational definitions is even more important [34]. In order to analyze the behavior of its processes, an organization has to get a certain volume of data (greater than the volume required at initial levels). Moreover, it is necessary to form homogeneous groups of data. This requires data to be collected in a consistent way, and measurement consistency is directly related to the quality of the operational definitions.
Considering this context, the Operational Definition of Measures sub-ontology addresses aspects related to measures collection and analysis. Figure 5 shows its conceptual model.

Fragment of the Operational Definition of Measure Sub-ontology
An Operational Definition of Measure details aspects related to the data collection and analysis of a Measure in an Organization [4, 10, 11]. An Organization establishes Operational Definitions of Measure taking Measurement Goals into account. For instance, measures related to process performance analysis goals are used to describe the processes behavior and, as such, must have operational definitions suitable for it.
Regarding data collection, an Operational Definition of Measure should indicate: \((i) \)the moment when measurement should occur. In order to integrate the measurement process with the software process, the measurement moment should be established in terms of the activity (Standard Activity) of the standard software process during which measurement should occur (e.g., Requirements Specification Approval); (ii) the measurement periodicity, that is, the frequency with which measurement should be performed (e.g. monthly, weekly, in each occurrence of the activity designated asmeasurement moment); (iii) the human role (Human Role) responsible for performing the measurement (responsible for measurement) (e.g., requirement engineer); and (iv) the Measurement Procedure to be followed in order to guide data collection [4, 10–12].
Analogously, regarding measurement analysis, an Operational Definition of Measure may indicate: the activity when the data collected for the measure should be analyzed (measurement analysis moment), the measurement analysis periodicity, the human role responsible for analyzing the collected data (responsible for measurement analysis), and the Measurement Analysis Procedure to be followed in order to guide data analysis [4, 10–12]. Information regarding measurement analysis is not defined in every Operational Definition of Measure, since there are some measures that are not analyzed separately. For instance, the measure project size could be used just to normalize other measures, not being necessary to analyze its data separately. In this case, the operational definition of the measure project size would not include information about measurement analysis.
Measurement Procedures and Measurement Analysis Procedures are procedures to be followed in order to guide data collection and analysis, respectively [4, 10–12]. A Measurement Procedure can include Measure Calculation Formulas. In turn, Measurement Analysis Procedures can suggest the use of Analytical Methods for representing and analyzing the measured values [4, 10, 11]. Histograms and bar charts are examples of analytical methods. Analytical methods that use principles of statistical control to represent and analyze values and are said to be Statistical Control Methods [22]. The XmR and mXmR charts [22] are examples of statistical control methods. At high maturity levels, measurement analysis procedures should indicate the use of statistical control methods.
A Predictive Model is a procedure used to predict a Derived Measure by quantifying its relations with other measures. A predictive model has a Measure Calculation Formula. A Predictive Model can be a General or a Calibrated Predictive Model. A General Predictive Model is a predictive model established considering data collected from projects of several organizations. Typically there are models proposed in the literature, such as the Putnam Model (\(E = S^{3}\)/ Ck\(^{3}T^{4})\) [35] that predicts the measure development effort from the measures size and time, considering also technologies used in the project. A Calibrated Predictive Model, in turn, is established based on data collected in a particular organization and according to certain operational definitions of measures. For instance, an organization could use data collected through projects for establishing a calibrated predictive model that aim to predict project effort based on their size and complexity .
A calibrated predictive model must quantify the relationship existing between at least two measures. Since calibrated predictive models should be established from a consistent group of data, these data should be collected using the same operational definition of measure. Therefore, a calibrated predictive model must be based on one specific operational definition of measure for each measure used to establish the calibrated predictive model.
4.1.4 The measurement sub-ontology
This sub-ontology addresses measurement per se, i.e., collecting and storing data for the measures. Its conceptual model is shown in the Fig. 6 .

Fragment of the Measurement Sub-ontology
Measurement is an action performed to measure a Measurable Element of a Measurable Entity by applying a Measure [4, 10–12]. As a result, a Measurement Result is obtained, which defines a measured value [4, 10–12]. The measured value must be a Scale Value of the Scale of the applied measure. For instance, the measurement of the measurable element changed requirements of the measurable entity Requirements Specification Document by applying the measure number of changed requirements could obtain a measurement result, which defines as measured value of the value 12.
Since a Measurement measures a Measurable Element and applies a Measure, this Measure must quantify that Measurable Element. Besides, if a Measurement measures a Measurable Entity that is an instance of a Measurable Entity Type, it can only measure Measurable Elements that characterize that Measurable Entity Type.
A Measurement has a Measurement Context that describes the circumstances in which the measurement occurred [4]. The measurement context is useful to group data or exclude values for measurement analysis, as well as to understand variations among values being analyzed. Regarding the example cited before, a possible measurement context could be: measurement carried out after changes in the legislationin which the system is based on.
A Measurement uses an Operational Definition of Measure. This Operational Definition of Measure should refer to the Measureapplied by the Measurement. In order to deal with this constraint, we defined the axiom MEA-A1, which says that if a measurement mea uses an operational definition of measure odm and applies a measure \(m\), then odm must refer to \(m.\)
MEA-A1: (\(\forall \) mea \(\epsilon \) Measurement, odm \(\epsilon \) Operational Definition of Measure, m \(\epsilon \) Measure)(uses (mea, odm) \(\wedge \) applies(mea, m)) \(\rightarrow \) refersTo(odm,m)
A Measurement is performed by a Human Resource, called the measurement executor, and it adopts a Measurement Procedure [4, 10–12]. Furthermore, a Measurement occurs during the occurrence of another activity (Activity Occurrence) (e.g., an occurrence of the activity Requirements Specification Approval) said to be the actual measurement moment. This activity occurrence is caused by a Project Activity (e.g., the activity RequirementsSpecification Approval defined to the project P) that tailors a Standard Activity (e.g., the activity RequirementsSpecification Approval defined in the Requirements Management standard process) (see [8]). Since an operational definition of measure is used to guide measurement, this Standard Activity has to be the one indicated as the measurement moment by the Operational Definition of Measure. Moreover, the measurement executor must play the Human Role indicated as responsible for measurement, and the measurement procedure adopted must be the same indicated by the operational definition of measure.
4.1.5 The measurement analysis sub-ontology
This sub-ontology treats the analysis of the collected data. Its conceptual model is shown in the Fig. 7.

Fragment of the Measurement Analysis Sub-ontology
A Measurement Analysis is an action performed to analyze values measured for a Measure characterizing the Measurable Entity measured [4, 10–12]. The values to be analyzed are described in Measurement Results, produced by Measurements. As a result, a Measurement Analysis produces a Measurement Analysis Result [4, 10–12]. An example of Measurement Analysis is the analysis of values measured for the measure requirements changing rate in order to characterize the measurable entity Requirements ManagementProcess in the project P.
The Operational Definition of Measure used in a Measurement Analysis must be the same one used in the Measurements that produced the Measurement Results being analyzed. The axiom MAN-A1 addresses this constraint by saying that if a measurement analysis man uses the operational definition of measure odm for describing the analysis of the measurement result mr produced by the measurement mea, then mea should have used odm.
MAN-A1: (\(\forall \)man\(\epsilon \)Measurement Analysis,odm\(\epsilon \)Operational Definition of Measure,mr\(\epsilon \)Measurement Result, mea\(\epsilon \)Measurement)(uses(man, odm)\(\wedge \)describesAnalysisOf(man,mr)\(\wedge \)produces(mea, mr))\(\rightarrow \)uses(mea,odm)
Besides, the Measurable Entity characterized by a Measurement Analysis must be the same Measurable Entity measured by the Measurements that produced the Measurement Results being analyzed. The axiom MAN-A2 addresses this constraint by stating that if a measurement analysis man characterizes the measurable entity met and describes the analysis of the measurement result mr produced by the measurement mea, then mea should measure met.
MAN-A2: (\(\forall \)man\(\epsilon \)Measurement Analysis, met\(\epsilon \)Measurable Entity, mr\(\epsilon \)Measurement Result,mea\(\epsilon \)Measurement,) (characterizes (man, met)\(\wedge \)describesAnalysisOf(man, mr)\(\wedge \)produces(mea, mr))\(\rightarrow \)measures(mea,met)
A Measurement Analysis adopts an Operational Definition of Measure that refers to the Measure being analyzed. As discussed in the Operational Definition of Measure sub-ontology (Sect. 4.1.3), an Operational Definition of Measure indicates the Measurement Analysis Procedure, the measurement analysis moment and the responsibility for the measurement analysis. Although not shown in Fig. 7, in a very similar way than in the case of the Measurement sub-ontology (Sect. 4.1.4), a Measurement Analysis is carried out by a Human Resource, said to be measurement analysis executor, in an Activity Occurrence said to be actual measurement analysis moment. As argued before with respect to Measurement, ideally, in a Measurement Analysis, the actual measurement analysis moment must be an Activity Occurrence caused by a Project Activity that tailors a Standard Activity indicated as the measurement analysis moment by the Operational Definition of Measure. Moreover, the measurement analysis executor must play the Human Role indicated as responsible for measurement analysis.
4.1.6 The software process behavior sub-ontology
Data are collected for measures, and they are analyzed aiming to provide information that support decision-making. At high maturity levels, information is applied for analyzing the software process behavior. The Software Process Behavior Sub-ontology deals with concepts, relations and constraints involved in software process behavior analysis. A fragment of its conceptual model is shown in the Fig. 8.

Fragment I of the Software Process Behavior Sub-ontology
In a Measurement Analysis that adopts a Statistical Control Method, it is possible to identify a Process Performance Baseline, established in relation to a Measure for a Stable Standard Software Process [4, 22].
According to the Software Process Ontology [8], a Standard Software Process refers to a generic process defined by an organization, establishing basic requirements for processes to be performed in that organization. A Stable Standard Software Process is a Standard Software Process with stable behavior. In other words, it is a Standard Software Process that has at least one Process Performance Baseline.
A Process Performance Baseline is identified from twenty or more Measurement Results [4, 22]. It is the range of results achieved by a Stable Standard Software Process\(, \)obtained from measured values of a particular Measure. This range is used as a reference for process performance analysis and it is defined by two limits: process performance baseline upper limitand process performance baseline lower limit [22]. The values of the limits are Scale Values of the Scale of the Measure considered for establishing the baseline. This constraint is addressed by an axiom (SPB-A1), which says that if a scale value sv is a lower limit or an upper limit of a process performance baseline ppb established in relation to the measure \(m \)that has as scale \(s\), then svshould be a value of the scale \(s\).
SPB-A1: (\(\forall \) sv \(\epsilon \) Scale Value, ppb \(\epsilon \) Process Performance Baseline, m \(\epsilon \) Measure, s \(\epsilon \) Scale) ((processPerformanceBaselineLowerLimit(sv, ppb) \(\vee \) processPerformanceBaselineUpperLimit(sv, ppb)) \(\wedge \) isEstablishedInRelationTo (ppb, m) \(\wedge \) has(m, s) \(\rightarrow \) memberOf(sv, s))
As stated before, when a Standard Software Process has a Process Performance Baseline established for it, it is said to be a Stable Standard Software Process. For instance, consider the analysis of values measured for the measure requirements changing rate, related to the RequirementsManagement standard software process of the organization Org. Using the statistical control method XmR control chart, this measurement analysis could identify a process performance baseline PPB-01, composed by upper and lower limits 0,1 and 0.25, respectively. Thus, in this context, the Requirements Management standard software process is considered a stable standard software process.
A Process Performance Baseline is established in a particular context (Context of Process Performance Baseline). In the previous example, we could have the following situation for the first process performance baseline established to the Requirements Management standard software process: the data used to establish the baseline were collected in sixsmallprojects developed by the same team, under usualconditions. In the analysis, two points collected on exceptional situations were excluded.
Process Performance Baselines are used to define Process Performance Models [4]. A Process Performance Model is a specific type of Calibrated Predictive Model that uses Process Performance Baselines (at least 2) to establish and quantify the relations between Measures. The Process Performance Baselines used by a Process Performance Model must be defined in relation to the measures whose relations are quantified by that Process Performance Model.
Figure 9 shows another fragment of the conceptual model of the Software Process Behavior Sub-ontology.

Fragment II of the Software Process Behavior Sub-ontology
A Specified Process Performance is the range of values that describes the desired results of a Standard Software Process, considering a particular Measure. A Specified Process Performance is defined by two limits: specified process performance upper limit and specified process performance lower limit [22]. As well as baseline limits, the specified process performance limits are values of the Scale of the Measure used for defining the Specified Process Performance. Returning to the previous example, consider the Requirements Management standard process of the organization Org. It could have a specified process performance defined in relation to the measure requirements changing rate, given by the upper and lower limits 0 and 0.25, respectively.
Process Capability characterizes the ability of a Stable Standard Software Process to achieve the Process Performance Specified for it, considering a particular Measure [4, 22]. Process Capability is obtained from a Process Performance Baseline and it is calculated in relation to a Specified Process Performance. A Process Capability is determined by applying a Process Capability Determination Procedure [22]. This kind of procedure defines a logical sequence of operations used to determine the capacity of a Stable Standard Software Process and to identify if it is a capable process. The following is an example of a Process Capability Determination Procedure: PCDP-01: calculate the process capability index using thecalculation formulaCp = (ULb\(-\)LLb)/(ULs\(-\)sLLs),where Cp = process capability index,ULb = processperformance baseline upper limit, LLb = process performancebaseline lower limit, ULs = specified process performanceupper limit andLLs = specified process performance lowerlimit. If Cp is \(\le \)1, verify if the process performance baselinelimits are withinthe specified process performance limits.In the affirmative case, the process is capable. Otherwise,the process is not capable.
When the Process Capability revels that the process is capable of achieving the expected performance, we have a Capable Standard Software Process [4, 22]. Regarding the examples cited before, consider applying the process capability determination procedure PCDP-01 to the RequirementManagement standard process of the organization Org. As a result, we obtained a capability index 0.6. Besides, consider that the process performance baseline limits are within the specified process performance limits. So, this Requirement Management standard process is a Capable Standard Process with respect to the measure requirements changing rate.
4.2 The instrument for evaluating the suitability of a measurement repository for SPC
The IESMR development started after the study based on a literature systematic review described in Sect. 3. Based on the measurement related factors that impact SPC implementation identified in the study, we defined a set of requirements for a measure to be used in SPC. These requirements are presented in Table 6.
Based on these requirements, we created the first version of the IESMR, which was composed of one checklist used to evaluate a measure and its data. This version was used to evaluate measurement repositories of two organizations in order to verify if the identified requirements were correct. For this, we asked if a measure that fulfilled the requirements of IESMR could really be used in SPC and if a measure that did not fulfill the requirements was really unsuitable for SPC. To answer these questions, we plotted in control charts the data collected for the measures evaluated. As a result, we observed that the measures considered suitable for SPC according to IESMR could be correctly plotted in control charts and they provided useful information about the processes performance. By contrast, the measures considered unsuitable by IESMR could not be plotted in control charts or, when they could, they did not describe the process performance.
Despite the fact that the initial results have shown that the set of requirements identified was appropriate, we noticed that the instrument should be restructured. Then, we improved the instrument reorganizing it into four checklists: one for evaluating the Measurement Plan, one for the measurement repository structure, one for the measures defined, and one last for the data collected for the measures. In addition to that, we described procedures for evaluating each requirement and the possible corrective actions to be taken when a requirement is not fulfilled. The second version of IESMR was used to evaluate the measurement repository of a third organization. After that, we carried out some minor adjustments in IESMR, basically related to its wording, aiming to improve its understanding. Finally, for determining the suitability degree of a measurement repository for SPC in percentage, we added some principles of Fuzzy Logic, getting the current version of it, whose overview is shown in Fig. 10.

Overview of the IESMR
In IESMR, each item is evaluated by a set of requirements present in checklists. The evaluation of an item against each requirement can produce one of the following results: (i) Satisfied, which means that the item satisfies totally the requirement and no corrective action is necessary; (ii) Largely Satisfied, Reasonably Satisfied or Precariously Satisfied, which means that the item does not completely satisfy the requirement, but it is possible to take actions to adapt it in order to satisfy the requirement and, consequently, to allow the use of the evaluated item in SPC. The level of satisfaction (largely, reasonably or precariously) is related to the effort required to perform the actions (the more effort is necessary, the less the satisfaction level will be); and (iii) Dissatisfied, meaning that the item does not satisfy the requirement and there are no possible actions to adapt it for being used in SPC.
When the result of the evaluation of a requirement is Largely Satisfied, Reasonably Satisfied or Precariously Satisfied, Actions for Suitability are suggested. These actions are guidelines for correcting the item so that it can be used in SPC. When the result is Dissatisfied, recommendations of the Body of Recommendations for Software Measurement can be used to rebuild the item (BRSM is presented in the next section).
The results of the evaluation are recorded in a document called Evaluation Diagnosis. It includes the detailed evaluation of each item (filled checklists and comments), the actions for suitability suggested, and the degree of suitability of the measurement repository for SPC, which is informed as a percentage. As said before it is calculated using Fuzzy Logic (see [19]).
Tables 7, 8, 9, 10 present the IESMR checklists. The checklists to evaluate the Measurement Plan (Table 7) and the measurement repository structure (Table 8) are applied only once during an evaluation of a measurement repository. Checklists to evaluate the measures (Table 9) and the collected data (Table 10) must be applied once for each measure evaluated. The possible answers for a requirement in a checklist are: S = Satisfied; LS = Largely Satisfied; RS = Reasonable Satisfied; PS = Precariously Satisfied; D = Dissatisfied; NE = It could not be evaluated.
It is important to point out that, according to the approach for software process improvement at high maturity levels, only processes that are critical to the organizational goals must be submitted to SPC. So, it is desirable that the organization identifies these processes before carrying out the evaluation, in order to avoid evaluating measures that are not related to these processes.
As shown in the previous tables, most of the requirements of the IESMR can produce one of the following results: Satisfied, Largely Satisfied, Reasonably Satisfied, Precariously Satisfied or Dissatisfied. Only a few ones (requirements 3 to 6 in Table 9, and requirement 2 in Table 10) have as possible results Satisfied or Dissatisfied. In these cases, there is no possibility of partially fulfill the corresponding requirement, since there are no possible actions for correcting it. For example, the requirement “The measure is related to the performance of a process” (requirement 5 of Table 9) is satisfied or not. If a measure is not able to describe the performance of a process, there is nothing that can be done to use it in the SPC.
In order to guide the evaluation, for each requirement, we provided a description of what a possible answer means. For instance, concerning the requirement “The projects are satisfactorily characterized” (requirement 2 of Table 8), the following descriptions are provided:
-
Satisfied: The project characterization is explicit. That is, there is a characterization schema formally defined and implemented in the measurement repository structure, taking into account the basis on relevant criteria that enable the organization to identify the profiles of projects that it develops. The subsets composed by projects with the same profile (that is, projects of which criteria of characterization have the same values) are homogeneous.
-
Largely Satisfied: The project characterization is explicit, but it requires some additional criteria. These criteria can be identified from data of projects stored in the measurement repository, interviews with projects members and projects documents.
-
Reasonably Satisfied: The project characterization is explicit, but it requires many additional criteria. These criteria can be identified from data of projects stored in the measurement repository, interviews with projects members and projects documents.
-
Precariously Satisfied: The project characterization is implicit. That is, there is no formal characterization to the projects, but it is possible to identify a characterization by analyzing data of projects stored in the measurement repository, carrying out interviews with projects members and analyzing projects documents.
-
Dissatisfied: There is no explicit characterization, or it is inadequate, and it is not possible to identify criteria for determining a satisfactory characterization analyzing the data of projects stored in measurement repository, carrying out interviews with projects members or analyzing projects documents.
As said before, if the result of the evaluation of a requirement is Largely Satisfied, Reasonably Satisfied or Precariously Satisfied, actions for suitability are suggested, aiming to support the organization to change the evaluated item to fulfill the requirement. So, for each requirement, we identified potential problems and actions for suitability. For instance, to the requirement 2 of Table 8, the following potential problems and actions for suitability were identified:
-
Problem I: The projects have an implicit characterization in the measurement repository\(.\)Actions for Suitability: (a) Define explicitly the projects characterization by analyzing data of projects that are stored in the measurement repository. For this, it is necessary to identify the data that describe characteristics of the executed projects, such as size, constraints, team features, technologies, development paradigm, application domain, project type etc. (b) Restructure the measurement repository making the identified characterization criteria explicit in classes (or tables) and properties (or attributes). (c) Record appropriately the characterization data of the projects in the restructured measurement repository.
-
Problem II: The projects do not have characterization (implicit or explicit) in the measurement repository. Actions for Suitability: Set up a characterization based on the analysis of documents and interviews with people related to the projects. For example, project managers can provide relevant information about characteristics of the executed projects, such as technologies, development paradigm, project type, considered constraints, and so on. This action must be followed by the actions (b) and (c) described in the actions for suitability of the problem I.
-
Problem III: The explicit characterization of the projects requires additional criteria. Actions for Suitability: Refine the project characterization, identifying new criteria. This can be done carrying out the actions cited on problems I and II.
Despite the fact that the IESMR provides detailed guidelines to carry out evaluations of measurement repositories, it is important to notice that the user of the instrument must have some experience in software measurement practices. Ideally, the instrument should be used by quality managers, in particular measurement managers.
4.3 The body of recommendations for software measurement suitable for SPC
Although there are models and standards devoted specifically to address measurement, they do not satisfactorily address how to carry out measurement aiming at SPC. Thus, aiming to complement our strategy with a practical guide to organizations to carry out software measurement suitable for SPC, we defined the BRSM. It was built taking as a basis the IESMR requirements, the conceptualization provided by the RSMO, the main measurement proposals found in the literature, some practical experiences and aspects related to measurement present in CMMI [4] and MR MPS.BR [5].
The BRSM is composed of recommendations related to eighteen aspects organized in five groups. For each aspect, we defined a set of recommendations. The BRSM groups are (Table 11): (i) Software Measurement Preparation, which contains recommendations related to aspects that should be treated before starting the measurement; (ii) Alignment between Software Measurement and Organizational Goals, which contains recommendations for carrying out measurement aligned with organizational business goals and projects goals; (iii) Software Measures Definition, which contains recommendations for correctly elaborating operational definitions of measures; (iv) Software Measurement Execution, which contains recommendations for appropriately collecting and storing data for the measures defined; and (v) Software Measurement Analysis, which contains recommendations for analyzing the data collected, aiming to meet the information needs previously identified.
Although BRSM has recommendations that must be used aiming at SPC implementation, there are recommendations that deal with measurement at initial maturity levels. This occurs because, as said before and pointed out by results of the study based on systematic review (Sect. 3), most problems related to measurement at high maturity levels usually had an origin at initial levels. Frequently, these problems have less impact on measurement results at initial levels so, only when organizations start SPC practices, they realize these problems.
Table 12 shows, as an example, some recommendations of the BRSM regarding three aspects: Project Characterization, Granularity Level of a Measure and Operational Definition of Measure.
Concerning the evaluation of BRSM, it was evaluated by experts by means of the peer review technique. The reviewers were appraisers able to carry out assessments of high maturity levels, since they have theoretical knowledge about SPC and practical experience with high maturity organizations.
During the peer review, the reviewers filled in a sheet as the one shown in Fig. 11. Each comment made by reviewers was classified by them in one of the following five categories: HT—High Technical (a major problem regarding the technical quality of the BRSM); LT—Low Technical (a minor problem regarding the technical quality of the BSMR); E—Editorial (a problem regarding the wording of the BRSM); G—General (a problem related to the BRSM as a whole); and Q—Question (a question, meaning that probably the content of the BRSM should be improved aiming to provide information more clearly).

Template used in the peer review
After sheets had been filled in by the reviewers, we built a table summarizing the categories of the comments made for each reviewer regarding each BRSM item. That table helped us to see how many reviewers had made comments concerning each BRSM item and the comment category. Table 13 shows a fragment of the table with the summary of the comments.
Some recommendations received comments from every reviewer (e.g., the R1 recommendation that addresses the aspect Identification of Measurement Goals, from the Alignment between Software Measurement and Organizational Goals group), and others did not receive any comment (e.g., recommendations related to the Execution of Consistent Measurements aspect, from Software Measurement Execution group).
Using the table with the comment summary as a starting point, we analyzed the comments made by reviewers and the suggested changes to be made. If more than one reviewer made comments about the same point of BRSM, we carried out an analysis of the consistency of the comments before changing BRSM. As a whole, the comments were homogeneous, i.e., there were not divergences between them.
Regarding the BRSM content, most of the time, comments identified information that was not being provided by BRSM. This led us to improve the BRSM content aiming at a better understanding of its users. Technical issues were also pointed out. Most of the time, the comments were about making explicit aspects that were implicit in the BRSM wording. For instance, two reviewers suggested that it should be explained that the responsiblity for the measure collection must be the real source of the data being collected. Some changes in the BRSM structure were also suggested and accepted.
It is important to say that some suggestions were not accepted because they included features that are outside the BRSM scope, such as guidelines for using statistical techniques and causal analysis.
5 Related works
As cited previously, regarding the domain of software measurement, there are some initiatives committed with ontology-based modeling and formalization of this domain, such as the one proposed by Martín and Olsina [29], called here MO-ontology, and the one proposed by Bertoa, Vallecillo and García [30], called here SMO-ontology. These works are focused on the basic aspects of measurement and are very in line with our Measurable Entities & Measures sub-ontology, since they are inspired in some common sources, such as ISO/IEC 15939 [10].
Concerning the similarities, there are many common concepts, such as concepts related to measurable entities (entities in the MO and SMO), measures (metrics in the MO, and measures in SMO), measurable elements (attributes in the MO and SMO). However, there are also many differences. For instance, several concepts present in RSMO are not explicit in these ontologies, such as sub-types of goals. RSMO distinguishes types of goals, in order to make explicit the application of a measure according the goal to which it is associated. This information is relevant for appropriately defining a measure. Besides, since those works did not focus on measurement aspects related to high maturity levels, they also did not address many concepts addressed by RSMO, such as process performance baseline, process capability and specified process performance. RSMO addresses high maturity especially in the Software Process Behavior sub-ontology and part of the Operational Definition of Measures sub-ontology. A detailed discussion about the differences between RSMO and those proposals can be found in [15].
Although the use of UFO as a basis to our ontology is not discussed in this paper, we can state that it was of great value and a distinctive point of our work when compared with those two others. It allowed identifying several problems and drove the ontology engineering process, making explicit ontological commitments that were implicit and elucidating conceptual mistakes. Some discussions regarding the use of UFO in the RSMO development and its benefits can be found in [14–17].
Regarding the evaluation of measures for SPC, Tarhan and Demirors [36, 37] defined measure usefulness to SPC as a requirement for choosing a process to SPC. Nevertheless, since the focus of their approach is the selection of processes for SPC, the approach is limited concerning measures evaluation. The authors themselves state that the study of the usefulness of measures considering only the attributes defined by their proposal is not enough to select the most appropriate measures to SPC [37].
Finally, concerning recommendations for software measurement, there are several works addressing software measurement process, such as [3, 10, 11, 32], among others. However, there is still no consolidated set of guidelines on how to perform measurement in order to reach high maturity levels. As mentioned earlier, models like CMMI [4] do not provide sufficient guidance in this context. With respect to high maturity, we found few studies that deal with measurement. The initiatives of Dumke and colleagues [38, 39] have particular relevance. However, these works deal more specifically with the application of data in SPC than with the measures definition and data collection aiming at SPC.
6 Final considerations and future work
In this paper we presented a strategy defined to support software organizations prepare themselves for SPC, helping them evaluating and adapting their measurement repositories, as well as performing measurements appropriate to this context. The strategy is composed by three components: a Reference Software Measurement Ontology, which provides the vocabulary and conceptualization regarding software measurement; an Instrument for Evaluating Measurement Repositories for SPC, which supports the evaluation of existing measurement repositories guiding their adjustment for SPC (when it is possible and necessary); and a Body of Recommendations of Software Measurement Suitable for SPC, which provides guidelines to carry out software measurement aiming at SPC.
Although the components have detailed descriptions, there is a certain level of subjectivity that is inherent to their application, especially regarding the IESMR. For instance, the guidelines provided by the IESMR could be interpreted in different ways by different users. In the example presented in Sect. 4.2, the difference between the results Largely Satisfied and Reasonably Satisfied for the requirement “The projects are satisfactorily characterized” are the words some and many. This difference should be judged by the instrument user. Consequently, somewhat different results could be obtained from different users. Nevertheless, subjectivity is a characteristic present in most of the standards/models that deal with evaluation of software process quality. For instance, the appraisal methods from CMMI [4], ISO/IEC 15504 [21] and MR MPS.BR [5] provide guidelines and requirements to be satisfied in order for an organization to achieve a certain maturity/capability level. However, the evaluation of the processes and evidences against the requirements depends on the appraiser judgment.
Concerning the evaluation, the components were evaluated individually in verification and validation activities. For the RSMO, we used tables to verify if the ontology answers the competency questions and we used instantiations to check if situations of the real world could be represented using RSMO. For the IESMR, we verified if the requirements were correct and, then, we evaluated if the use of the instrument produced the expected results. Regarding the BRSM, we used peer reviews in which reviewers evaluated the component considering its form and content.
After the components have being individually evaluated, we used the strategy as a whole in a CMMI level 2 software organization which was starting to implement the practices required by CMMI level 3. Although it is not a requirement for level 3, this organization wanted to anticipate the adjustment of measures and data aiming to implement SPC in the next future (to fulfill CMMI level 4 requirements). Thus, during the implementation of the CMMI level 3 practices, we used our strategy for helping the organization prepare itself for SPC. The organization was successfully evaluated as a CMMI level 3 organization. After that, we analyzed the behavior of the critical processes using SPC techniques. The results showed that the measures and their data were suitable for analyzing the critical processes behavior. Unfortunately, after achieving CMMI level 3, the organization interrupted the implementation of the high maturity practices. Consequently, it was not possible to appropriately evaluate the strategy as a whole.
We intend to carry out new evaluations of the strategy in order to get results that allow us to achieve conclusions concerning its use as a whole. In this sense, we intend to perform some case studies aiming to investigate issues such as:
-
(i)
The strategy effectiveness, i. e., if the strategy, in fact, helps organizations to obtain measures and data suitable for SPC. Although the organization before mentioned has canceled the implementation of the high maturity practices, it was possible to evaluate the strategy effectiveness in that organization, since after the organization has used the strategy it was possible to analyze the critical processes behavior. However, it is necessary to obtain other results from different organizations, in order to analyze the strategy effectiveness in different scenarios. Formal CMMI level 4 or MPS.BR level B appraisals can be used as additional evaluations of the strategy effectiveness.
-
(ii)
The strategy cost-benefit, i.e., the cost and benefits of using the strategy. In order to investigate this issue, we intend to compare the time and effort spent to go from CMMI level 3 to level 4 (or from MPS.BR level C to level B) in organizations that used the strategy with time and effort spent in organizations that did not use the strategy. This investigation must consider the two scenarios in which the strategy can be used. In the first one there are organizations that are starting the high maturity practices and need to adapt their measures and data; in the second scenario there are organizations starting a measurement program at initial levels and using the strategy since then. In the first scenario, we also intend to analyze the time and effort spent to carry out the measurement repository evaluation and adjustment, as well as how much it means in relation to the total time and effort spent to go from CMMI level 3 to level 4 (or from MPS.BR level C to level B).
-
(iii)
The strategy usability, i.e., if the strategy is easy to use. We intend to investigate this issue by means of interviews or surveys applied to people who used the strategy in the organizations.
-
(iv)
The strategy adequacy, i.e., if the strategy is appropriate to the organization. To investigate this issue, we intend to perform interviews or surveys with people who used the strategy in the organizations, aiming to verify if the strategy was appropriate to the organization as well as obtain feedbacks and suggestions for improving the strategy as a whole.
Although we intend to carry out case studies, interviews and surveys to investigate the aforementioned issues, we are aware of some limitations and threats. First, the use of the strategy as a whole demands time, since it has to be used by organizations that are starting to implement high maturity levels practices or organizations that are at initial maturity levels but intend to achieve high maturity in a next future. Moreover, only after the practices related to process behavior analysis being implemented, we would be able to get results regarding the complete use of the strategy. Second, it may be difficult to have access to organizations starting high maturity practices. For instance, here in Brazil, currently there are very few organizations starting to implement high maturity practices. In fact, most of the organizations involved in software process improvement programs are in more initial maturity levels. Consequently, it can be difficult to obtain results, in the short term, from the complete use of the strategy in several organizations. Thus, comparisons necessary to investigate the aforementioned issues (especially the strategy cost-benefit) can be initially limited. We expect to have more organizations looking for high maturity levels in the near future, and this will provide other opportunities for evaluating the strategy in more organizations.
In order to motivate organizations to use the components, courses have been given to enable people to use them. Besides, aiming to facilitate the use of the components, we are working on some improvements. Originally, the strategy did not have any specific tools to support its use. The RSMO and the BRSM were described as documents. The IESRM, in turn, was composed basically by a document (the guide), a set of electronic spreadsheets, and an application built using MatlabFootnote 2. More recently, to support the use of the components, tools are being developed. For the IESRM, there is being developed a web application containing the checklists and all the guidelines about how to perform an evaluation. For the BSRM, a web site is being built aiming to make the recommendations available to users and support their use, evaluation and improvement. By doing this we expect to increase the number of organization using the components, and the strategy as a whole.
It is worthwhile to notice that despite the fact that the strategy proposes a combined use of its components, they can also be used individually. The components are being used individually in some organizations. For instance, three organizations that are at initial maturity levels are using the BRSM as a guide to carry out measurements, and another is using the RSMO as a reference model for building their measurement repository. Feedbacks provided by these users will allow us to improve the corresponding components.
Currently, the RSMO is being used as a conceptual specification for developing and integrating tools and measurement repositories of the High Maturity Environment at LENS (Software Engineering Laboratory) in COPPE/UFRJ. This environment aims to support software organizations to accomplish process improvement practices, especially at high maturity levels. The RSMO is also being used as a reference conceptual model for developing tools to support software measurement in ODE (Ontology-based Development Environment) [40] at NEMO (Ontology & Conceptual Modeling Research Group) in UFES. RSMO is also being used in the definition of a conceptual architecture for software measurement.
Notes
Competency questions are the questions that the ontology must be able to answer. The ontology must contain a necessary and sufficient set of concepts, relations, properties and axioms to represent and solve these questions [31].
Available in http://www.mathworks.com.
References
Card DN (2004) Statistical Techniques for Software Engineering Practice. In Proceedings of the 26th international conference on software engineering - ICSE’2004, Scotland, pp 722–723
Card DN, Domzalski K, Davies G (2008) Making statistics part of decision making in an engineering organization. IEEE Softw 25(3):37–47
Kitchenham B, Jeffery DR, Connaughton C (2007) Misleading metrics and unsound analyses. IEEE Softw 24(2):73–78
SEI (2010) Capability Maturity Model Integration—CMMI-DEV 1.3. Carnegie Mellon Software Engineering Institute, Pittsburgh, Pennsylvania
Montoni M, Rocha AR, Weber KC (2009) MPS.BR: a successful program for software process improvement in Brazil. Softw Process Improve Practice 14:289–300
Dumke R, Ebert C (2010) Software measurement: establish—extract—evaluate—execute. Springer, Berlin, Heidelberg
Guizzardi G (2005) Ontological foundations for structural conceptual models. Universal Press, The Netherlands
Briguente ACO, Falbo RA, Guizzardi G (2011) Using a foundational ontology for reengineering a software process ontology. In: Proceedings of the XXVI Brazilian Symposium on Data Base
Falbo RA (2004) Experiences in using a method for building domain ontologies. In: Proceedings of the fourth international conference on quality software—QSIC’2004, IEEE Computer Society, Braunschweig, pp 162–169
ISO/IEC (2007) ISO/IEC 15939 (E) Software engineering—software measurement process. International Organization for Standardization and the International Electrotechnical Commission, Geneva, Switzerland
McGarry J, Card D, Jones C, Layman B, Clark E, Dean J, Hall F (2002) Pratical software measurement: objetive information for decision makers. Addison Wesley, Boston
IEEE (1998) Std 1061—IEEE standard for a software quality metrics methodology
Villela K, Rocha AR, Travassos GH (2005) The use of an enterprise ontology to support knowledge management in software development environments. J Braz Comput Soc 11(2):45–59
Barcellos MP, Falbo RA (2009) Using a foundational ontology for reengineering a software enterprise ontology. In: Proceedings of the joint international workshop on metamodels, ontologies, semantic technologies, and information systems for the semantic web (MOST-ONISW 2009). Lecture Notes in Computer Science 5833:179–188
Barcellos MP, Falbo RA, Dalmoro R (2010) A well-founded software measurement ontology. In: Proceedings of the 6th international conference on formal ontology in information systems (FOIS 2010), Toronto
Barcellos MP, Falbo RA, Rocha AR (2010) Establishing a well-founded conceptualization about software measurement in high maturity levels. In: Proceedings of the 7th international conference on the quality of information and communications technology(QUATIC 2010), Oporto, Portugal, pp 467–472
Barcellos MP, Falbo RA, Rocha AR (2010) A well-founded software process behavior ontology to support business goals monitoring in high maturity software organizations. In: Proceedings of the IEEE International EDOC Enterprise Computing Conference Workshops, Vitória - ES, pp 253–262
Barcellos MP, Falbo RA, Rocha AR (2012) Using a reference domain ontology for developing a software measurement strategy for high maturity organizations. In: Proceedings of the IEEE international EDOC enterprise computing conference workshops, Pequim, China, pp 114–123
Barcellos MP, R. RA, Falbo RA (2010) Evaluating the suitability of a measurement repository for statistical process control. In: Proceedings of the 2010 ACM-IEEE international symposium on empirical software engineering and measurement. ACM, New York, pp 1–10
ISO/IEC (2008) ISO/IEC 12207:2008—Systems and software engineering—software life cycle process. International Organization for Standardization and the International Electrotechnical Commission. Geneva, Switzerland
ISO/IEC (2003) ISO/IEC 15504–2—Information technology—software process assessment. International Organization for Standardization and the International Electrotechnical Commission, Geneva, Switzerland
Florac WA, Carleton AD (1999) Measuring the software process: statistical process control for software process improvement. Addison Wesley, Boston
Montoni M (2010) Investigation regarding critical sucess factors in software process improvement initiatives. Doctorate Thesis, Federal University of Rio de Janeiro, COPPE/UFRJ, Rio de Janeiro, Brazil (in Portuguese only), Computation and Systems Engineering Program
Kitchenham B (2007) Guidelines for performing systematic literature reviews in software engineering - technical report EBSE-2007-01. Departament of Computer Science Keele University, Keele
Barcellos MP, Falbo RA, Rocha AR (2012) Software measurement related factors that influence statistical process control: a systematic literature review. Information and Software Technology (under revision)
Uschold M, Jasper R (1999) A framework for understanding and classifying ontology applications. In: Proceedings of IJCAI workshop on ontologies and problem-solving methods. Stockholm, Sweden, pp 1–11
Guizzardi G (2007) On ontology, ontologies, conceptualizations, modeling languages and (meta)models. In: Vasilecas O, Edler J, Caplinskas A (eds) Frontiers in artificial intelligence and applications, databases and information systems IV IOS Press, Amsterdam
Guarino N (1998) Formal ontology and information systems. In: Proceedings of the international conference in formal ontology and information systems—FOIS’98, Trento, pp 3–15
Martin MA, Olsina L (2003) Towards an ontology for software metrics and indicators as the foundation for a cataloging web system. In: Proceedings of the first latin american web congress (LA-WEB’03), Santiago, Chile
Bertoa MF, Vallecillo A, García F (2006) An ontology for software measurement. In: Proceedings of the ontologies for software engineering and software technology. Springer, Berlin, Heidelberg, pp 175–196
Gruninger M, Fox MS (1995) Methodology for the design and evaluation of ontologies. In: Proceedings of the IJCAI’95—workshop on basic ontological issues in knowledge sharing
Basili VR, Rombach HD, Caldiera G (1994) Goal question metric paradigm. Encyclopedia of software engineering, vol 2. Wiley, Hoboken
Kitchenham B, Hughes RT, Linkman SG (2001) Modeling software measurement data. IEEE Trans Softw Eng 27(9):788–804
Kitchenham B, Kutay C, Jeffery R, Connaughton C (2006) Lessons learnet from the analysis of large-scale corporate databases. In: Proceedings of the 28th international conference on software engineering—ICSE’06, Shanghai, China, pp 439–444
Putnam L (1978) A general empirical solution to the macro software sizing and estimation problem. IEEE Trans Softw Eng: 345–361
Tarhan A, Demirors O (2008) Assessment of software process and metrics to support quantitative understanding. Lect Notes Comput Sci 4895:102–113
Tarhan A, Demirors O (2006) Investigating suitability of software process and metrics for statistical process control. Lect Notes Comput Sci 4257:88–99
Dumke R, Côté I, Andruschak OT (2004) Statistical process control (SPC)—a metric-based point of view of software processes achieving the CMMI level four. Technical Report, Dept. of Computer Science, University of Magdeburg
Dumke RR, Braugarten R, Blazey M, Hegewald H, Reitz D, Drichter K (2006) Software process measurement and control—a measurement-based point of view of software processes. Technical Report, Dept. of Computer Science, University of Magdeburg
Falbo RA, Ruy F, Dalmoro R (2005) Using ontologies to add semantics to a software engineering environment. In: Proceedings of the17th international conference on software engineering and knowledge engineering, Taipei, China, pp 151–156
Acknowledgments
This research is funded by the Brazilian Research Funding Agencies FAPES (Process Number 52272362/11) and CNPq (Process Number 483383/2010-4).
Author information
Authors and Affiliations
Corresponding author
Rights and permissions
Open Access This article is distributed under the terms of the Creative Commons Attribution 2.0 International License ( https://creativecommons.org/licenses/by/2.0 ), which permits unrestricted use, distribution, and reproduction in any medium, provided the original work is properly cited.
About this article
Cite this article
Barcellos, M.P., de Almeida Falbo, R. & Rocha, A.R. A strategy for preparing software organizations for statistical process control. J Braz Comput Soc 19, 445–473 (2013). https://doi.org/10.1007/s13173-013-0106-x
Received:
Accepted:
Published:
Issue Date:
DOI: https://doi.org/10.1007/s13173-013-0106-x