- Research
- Open access
- Published:
Ranking lawyers using a social network induced by legal cases
Journal of the Brazilian Computer Society volume 23, Article number: 6 (2017)
Abstract
Who are the most effective lawyers in the Labor Court of Rio de Janeiro? Using data from tens of thousands of legal cases, we construct a network of lawyers (directed and weighted) in order to answer this and other questions. The empirical evaluation reveals a network structure with features commonly founded in other real social networks such as short distances and heavy tailed weight distribution. Metrics such as vertex strength, Pagerank, and closeness were used to rank vertices, identifying the most effective lawyers in the network. By using external information about lawyers and their relationship to different trials we (partially) validate the rankings obtained through the network analysis. This study suggests that the network structure induced by lawyers contains useful information concerning their effectiveness within the community.
Introduction
The Labor Court in Brazil is responsible for settling disputes concerning labor relationships. It is divided into a Superior Labor Court (TST) with jurisdiction throughout the national territory and 24 Regional Labor Courts (TRT) with limited jurisdiction throughout the country. The Regional Labor Court—1st Region (TRT1)—has jurisdiction in the State of Rio de Janeiro.
Judicial labor cases are guided by the principles and norms established in the Procedural Law of Labor. A case has a plaintiff also called the complainant and a defendant also called the claimed. In a legal labor case, the plaintiff triggers the judiciary and is usually an employee, while the claimed is asked to defend himself before the court and is usually a company or an employer.
Currently, all new proceedings are electronic in the TRT1 and managed by a system known as PJe-JT System1 developed by the Superior Council of Labor Justice (CSJT) and is a branch of the PJe System which is developed by the National Council of Justice (CNJ) in partnership with the courts and participation of the Brazilian Bar Association. The PJe-JT was deployed in TRT1 in June 2012 and today has more than 713,000 and 57,000 cases in the first and second instances, respectively. All acts and documents of a proceeding are electronically registered. The data is publicly available (with the exception of those in secrecy of justice) and can be accessed through the web portal of Court2.
This paper uses information from cases available in the database of the PJe-JT System, in particular, information concerning the plaintiff and the defendant which usually have one or more lawyers. Despite the public portal, this information was obtained directly from the PJe-JT database but made anonymous by converting names of lawyers into random numbers in order to preserve their identity (we will use such numbers in this work).
Using the cases database, we build network of lawyers nodes correspond to lawyers and a directed edge from lawyer A to lawyer B indicates that A “lost” one or more cases to B. The idea is that when a layer loses a case to another lawyer, for former gives importance to the latter. Moreover, edge have weights to capture the number of lawyers in a given case and the number of times two lawyers have faced each other.
Figure 1 shows how a case is encoded in the network. Each case gives rise to a complete bipartite graph (plaintiff and defendant correspond to the two sets of nodes in the bipartite graph) with edges originating on the nodes (lawyers) that “lost” the case (red) and ending on the nodes (lawyers) that “won” (green). All edges generated by this complete bipartite graph have the same weight (number shown by the edge in the figure), and is given by the 1/w where w is the number of lawyers that won the case. The edge weight captures the importance of the lawyer in winning the case: a larger w yields less importance to a given lawyer in the winning set; a larger l (number of lawyers that lost the case) generates more edges to a given lawyer in the winning set. Each lawyer in the winning set has a weight given by the sum of the weights of the edges incident to the lawyer, which is simply given by l/w (shown in the figure). This number summarizes the importance of the lawyer in the case: the larger the number, the greater the importance. Thus, winning with less lawyers against more lawyers yields greater importance. An alternative methodology is to give each edge a weight of 1/(w l) such that the weight sum across all edges of a given case is 1. This implies that the weight of winning lawyer is always 1/w, independently of the number of losing lawyers. However, this fails to capture the intuition that winning against more lawyers confers more importance (for example, 2 lawyers winning against 10 lawyers should confer them more prestige than winning against just 1 lawyer).

Examples of networks induced by legal cases. Each legal case gives rise to a complete bipartite graph with directed edges from the lawyers that lost (in red) to the lawyers that won (in green) the case. The quadrants illustrates different numbers of lawyer that won and lost the case (edge weights are exlained in the main text). The final network is given by the union of these complete bipartite graphs
Figure 1 A illustrates that each of the three lawyers that lost the case divide their (unit) prestige between the two lawyers that won, thus all edge weights are 0.5, and since there are three lawyers in the losing set, each winner lawyer receives a weight of 1.5. In Fig. 1 B, the two winners received weight 1, which is less than the winners of Fig. 1 A, since they won against two lawyers instead of three. On the other hand, every losing lawyer divide its (unit) prestige equally, so if many lawyers win against one lawyer their weight will be smaller in comparison to winning with a smaller set of lawyers. For example, in Fig. 1 C three lawyers win the case, receiving weight of 0.33 from every losing lawyer, resulting in a total weight of 1 for each. However, in Fig. 1 D each winning lawyer receives the same weight of 0.33, but now there is only one losing lawyer, giving a total of 0.33 weight to each winner.
The final network is constructed by taking the union of all complete bipartite graphs (one for each legal case) and adding the weights of corresponding edges. Thus, the edge weight in the final graph is simply the sum of the weights of the corresponding edge across all bipartite graphs. Note that the final graph is not necessarily bipartite, as lawyers win and lose cases, and participate with different sets of lawyers in different cases. Once the final network is generated, a lawyer with a large in-degree (or a large in-weight) and a small out-degree (or small out-weight) is likely to have a greater importance in the network. Note that lawyers that win many cases against many lawyers are indeed relevant to this network. On the other hand, lawyers that win few cases against few lawyers are likely to have a lower relevance. Last, note that some law firms tend to register several lawyers for a given legal case, allowing any of them to officially represent the firm in the suit (mostly for convenience of the firm). The definition of weights used here in some sense compensates for this practice, as it divides by the number of lawyers in the winning set.
This paper explores the lawyer network described above. In particular, we provide a characterization of the network revealing several of its structural properties. Our empirical analysis shows that the structure of this network has various common features with respect to social networks. For example, distances are very short and weights follow a heavy-tailed distribution. Beyond network characterization, our main goal is to rank lawyers using just the network structure in order to reveal effective (or relevant) lawyers. We apply classical network ranking metrics, such as Pagerank and closeness and compare their rankings to the lawyers “efficiency” (measured in fraction of cases won). We also propose a modification to the classical Pagerank centrality metric in order to better reflect importance in the context studied. This small modification yields much better results as it exploits the meaning of the network structure—the fact that large out degrees (or heavy outgoing weight) is “prejudicial” to the node.
The remainder of this paper is organized as follows. In the “Related work” section, we briefly discuss the related work. In the “Data source and network” section, we present the dataset and the empirical analysis of the network. In the “Ranking lawyers” section, we present the lawyer rank yielded by different ranking metrics as well as the modified Pagerank metric. The “Conclusion” section concludes the paper with a brief discussion.
Related work
The idea of ranking individuals through social network analysis has been broadly explored in the literature. From scientists [1] to tennis players [2] to employees within an organization [3], such individuals have been ranked by analyzing some form of social network induced by their interactions. This approach has been quite successful in identifying influential or important individuals in various contexts, either by using generic network centrality metrics or by adapting or proposing context-dependent metrics to establish a more meaningful ranking.
For example, in the context of ranking tennis players, a directed and weighted social network where edges encode direct matches (from loser to winner) has been constructed from data available at the Association of Tennis Professionals (ATP) [2]. An algorithm similar to Pagerank was then used to establish an all-time ranking of all tennis players that ever played the game. A more recent study has taken into consideration the temporal aspects inherently present in sports, producing a ranking for any point in time (e.g., the best tennis player of the 70s or 90s) [4]. The idea behind this ranking is to introduce edge weights that capture the notion that the importance of a win decays with time (e.g., a win last week is more important for a ranking today than a win 5 years ago).
Collaboration networks among scientists have also been widely explored [1, 5]. In such networks, undirected weighted edges represent the co-authorship of scientific papers between scientists. Beyond structural properties of such networks, such as short distances and heavy-tailed degree distributions, these networks have been used to rank scientists and also identify communities (i.e., scientists working on similar fields of study) and different patterns of collaboration between different fields of study.
The interaction patterns between employees of an organization has also been used to construct social networks and to rank individuals according to their influence in the organization [3]. Beyond organizational ties within the organization such as the relationship between supervisor and supervised, the various interactions among individuals have a direct impact on the perception employees have of one another. In this context, social influence based on proximity between individuals and the power they exercise play a central role in establishing more meaningful rankings.
Networks have also been explored in the context of law and legislature. For example, a “Law Network” based on legal cases and citations between them has been constructed and analyzed in the context of American law [6]. The analysis focused on understanding the evolution of the American legal system over time. In a different scenario, a voting network and a donation network has been constructed and analyzed in the context of the Brazilian Congress. Nodes in these social networks are congressman and edges encode either similar voting pattern or similar donation pattern. These networks have been used to understand the impact of partisanship and regionality as well as ranking [7]. Last, a previous version of this work has also explored the same dataset and constructed the same network of lawyers. However, this prior work had a different weight definition and a limited study of the effectiveness of the rankings [8]. In comparison, this work proposes a variation to better encode the effectiveness of lawyers and also provides a better analysis of its effectiveness.
Data source and network
The data consisting of the legal cases used to build the network of lawyers was captured directly from the PJe-JT system for the TRT-1 - the Regional Labor Court with jurisdiction over the state of Rio de Janeiro. We selected electronic cases filed between June 2012 and October 2015 and from these we selected just the cases belonging to the following procedural classes of labor suit: Summary Proceedings, Highly Summarized Proceedings, and Ordinary Proceedings.
Summary Proceedings are regulated by Law 5584/70, and cover only cases of small amount, those not exceeding twice the value of minimum wage. It was created in order to speed up the verdict of individual work lawsuits, not allowing appeals and limited to three witnesses. Due to the very low value of the cases that are subject to Summary Proceedings, it proved inefficient in the Southern and Southeastern regions of Brazil where labor procedural demands are overwhelmingly larger than twice the value of the minimum wage [9].
Highly Summarized Proceedings, provided for in Article 852-A and the Consolidation of Labor Laws (CLT), deals usually with simple matters. For a case to fit in this class the claim value must not exceed 40 minimum wages. Some of its basic features are that applications should be presented in liquid form, the procedural steps must necessarily be resolved in a hearing, and the number of witnesses should be two.
Ordinary Proceedings are for cases that fall outside the Summary or Highly Summarized Proceedings. It has the following basic features: three witnesses (except inquiry that investigate serious faults requiring six witnesses), applications may be illiquid and there is a reporting requirement at sentence. It is typically used for complex cases or cases against public organizations.
Besides the three procedural classes, we will focus on four outcomes that can occur in these types of cases: lawsuit accepted, lawsuit partially accepted, lawsuit dismissed and lawsuit settled. Lawsuit accepted occurs when the judge upholds the request, accepts the request of the plaintiff and the plaintiff receives what was requested. Lawsuit partially accepted occurs when the judge makes a decision giving partial gains to the plaintif—the plaintiff wins the suits but not the full amount requested. Lawsuit dismissed occurs when the trial of the case is unfavorable to the plaintif—the judge makes a decision in favor of the defendant and not of the plaintiff (e.g., the plaintiff’s request was unfounded). Last, when the two parties make an agreement and the judge approves it, there is a settlement of the case [10].
Finally, we will consider only those cases that have been confirmed by the courts (cases that cannot be appealed) across all three classes. This means the legal case finished and the decision of the judge is final and cannot be modified, so appeals are no longer possible. Figure 2 shows all cases present in the database, the number of cases in different classes and different outcomes by class. Notice that the class Summary Proceedings has a minority of cases (less than 400) across all possible results, while the Ordinary Proceedings has approximately 10,000 cases (or more) in three of the possible results.

Number of cases divided by procedural classes. The number of lawsuit accepted (green), partial accepted (light green), dismissed (red) or lawsuit settled (blue) are shown for each class
The vertices of the network to be built from cases are lawyers and a directed edge from a lawyer A to B indicates that the lawyer A lost a case for B. So, we need to define the meaning of win or lose and for it we will use the results of the cases.
Recall that the construction of the network requires the notion of a lawyer wining or losing. We take the following approach: In proceedings where the lawsuit was accepted or partially accepted, we say that the plaintiff’s lawyers won over the defendant’s lawyers, giving rise to a directed (and weighted) edge from every defendant’s lawyer to every plaintiff’s lawyer (complete bipartite graph). In a dismissed case, we consider what the plaintiff’s lawyers lost to the defendant’s lawyers, giving rise to a directed (and weighted) edge from every plaintiff’s lawyer to every defendant’s lawyer.
Note that when the result of a case is a settlement, the lawyers and respective parties have reached an agreement. As shown in Fig. 2 these cases are the most frequent, which is expected because the CLT requires that conciliation proposals and agreements have absolute priority in the Labor Court [11]. Since such cases end with an agreement between the parties, we will not consider them in the construction of the network, as they cannot (easily) be used to unveil the relative importance of the lawyers in the case.
We start by characterizing the participation of lawyers in different cases. Figure 3 shows the fraction of the lawyers who participated in k or more cases. Note that most lawyers participated in just a single case (within the scope of our dataset). A little less than 10% of the lawyers won or lost more than 10 cases and this number drops to less than 0.5% when considering 100 cases or more. On the other hand, we have lawyers that participated in more than thousand cases, indicating that the participation of lawyers in legal cases follows a heavy-tailed distribution.

Complementary cumulative distribution function (CCDF) of lawyers who acted (black), tied (blue) won (green), or lost (red) in k or more processes
Figure 3 also shows that the participation of lawyers in settlements is larger. This indicates that some lawyers have only participated in cases that have been settled through an agreement. Also note that the tail of the distribution of participation in cases that were lost is heavier than participation in cases that were won. Intuitively, it is more “easy” (common) to lose a case than to win a case. In addition, the tail of the distribution of participation of lawyers in cases that were settled is even heavier—it is more “easy” (common) to settle a case than to lose a case. This analysis indicates that lawyers do participate in many cases both winning and losing, and thus this could give rise to an interesting network.
Table 1 provides information about the structure of the lawyers’ network, which has 17,575 vertices (lawyers) and 113,990 directed edges. We used the Python module Graph-Tool3 to build and analyze the network and the Python library Matplotlib4 to produce the plots. Note that the network has features commonly found in other networks [12], as we next discuss:
-
Low average path length and diameter: The network has an average path length very small in comparison to the number of nodes, only 3.95 in a set with 17,575 lawyers (ignoring edge weights and edge direction). The diameter of the network is also very small: 13. Social networks tend to have very small distances and this is also the case in the lawyers’ network.
Table 1 Network Info -
Sparse and connected: Many real networks are extremely sparse, showing a very low density (orders of magnitude less than 1), but are extremely “connected” with almost all vertices belonging to the largest connected component. The lawyers’ network has a very low density (3.69×10⁻⁴) and its largest connected component has 97.71% of network vertices. However, if we take directionality of the edges into consideration, the network’s largest strongly connected component has 45.97% of the vertices.
-
High clustering coefficient: A distinctive feature of social networks are their relatively high clustering (i.e., their tendency to form triangles). The lawyers’ network has a clustering coefficient of 7.71×10⁻³ which is one order of magnitude larger than the network density (3.69×10⁻⁴). It is important to note that a single legal case generates no triangles in the network—each case gives rise to a complete bipartite graph between lawyers of both parties. This explains the relatively small clustering coefficient of the lawyers’ network in comparison to other social networks.
-
Degree distribution with heavy tail: Another common feature among many real networks is a heavy-tailed distribution of different properties such as degree and edge weight (i.e., distributions that are quite uneven, with the average orders of magnitude smaller than the largest values observed). Figure 4 a shows the degree distribution of the lawyers’ network, indicating to be heavy-tailed as values much larger than the average (of 12.97) can be observed for both in and out degrees.
Fig. 4 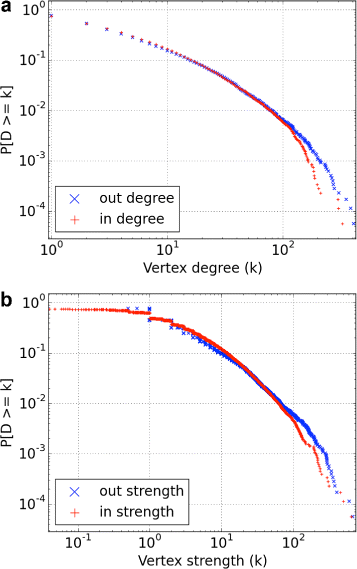
a Complementary cumulative distribution function (CCDF) of the in degree and out degree of the vertices of the lawyers’ network. b Complementary cumulative distribution function (CCDF) of the vertices strength (in and out)
-
Edge weight distribution with heavy tail: Fig. 5 shows the edge weight distribution of the lawyers’ network, clearly indicating to be heavy-tailed spanning various orders of magnitude. Note that most edges in the network have a small weight: over 30% of the edges have weight less than 1 and less than 1% of the edges have weight greater than 4. Intuitively, this indicates that the number of cases disputed by lawyers that have already faced each other is rather small.
Fig. 5 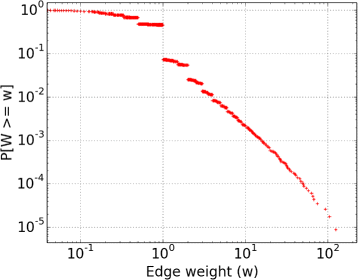
Complementary cumulative distribution function (CCDF) of edge weights. Note the large span of edge weights and the heavy tail of the distribution
-
Vertex strength distribution with heavy tail: The in or out vertex strength is given by the sum of the weights of its in or out edges, respectively. Figure 4 b shows the vertex strength distribution also indicating to be heavy-tailed. Note that this distribution is closely related to the degree distribution, and that the in strength (and in degree) exhibit a shorter tail than out strength (and out degree). This difference is more evident for weights greater than 100, and again indicates that is easier (more common) to lose than to win a case.
-
Reciprocity: The network has a reciprocity of 0.15, another feature commonly observed in social networks. This means that 15% of the lawyers that have faced each other have both won (equivalently, lost) at least once against each other (i.e., given an edge from A to B there is 15% chance of observing an edge from B to A). Thus, given a pair of lawyers that faced each other, the chance for one of them to have always won (equivalently, the other always lost) is 0.85.


Ranking lawyers
A key application of a network representation of individuals is ranking. In particular, we are interested in using the lawyers’ network to rank lawyers according to their effectiveness in conducting legal cases. Can the network structure alone reveal the most effective and also influential lawyers in the labor court of the state of Rio de Janeiro? To answer this question, we will consider different centrality metrics to construct construct a relative ranking of the lawyers. We then evaluate these rankings by quantifying the effectiveness of the lawyers in winning legal cases.
The simplest way to measure the “importance” of a vertex in a network is consider its degree, a metric known as degree centrality. In a weighted network, this centrality can be generalized to account for edge weights, giving rise to vertex strength [13]. Moreover, in a directed network this metric can be extended to in and out vertex strength, as with vertex degree. In particular, the in or out vertex strength is just given by the sum of edge weights incoming or outgoing from that vertex, respectively.
Table 2 shows the top 10 nodes of the lawyers’ network with respect to their in and out strengths along with their in and out degrees. Note that a large degree vertex does not necessarily have a large strength, both for in and out. This occurs because some lawyers face off the same lawyers several times, creating a large weight on the edge. Recall that out edges correspond to losing cases so effective lawyers will tend to have larger in degrees and smaller out degrees. Thus, the in vertex strength is a candidate metric for ranking the lawyers.
Pagerank [14] is an algorithm first used by Google to rank webpages that can be used to rank nodes in any directed and weighted network. The key idea of the algorithm is to define importance recursively: a node is important if important nodes point to it. The Pagerank of a vertex is defined by the following equation:
where d is the damping factor (set to 0.85 in this work, a traditional value used in several articles), n is the number of nodes in the network, Γ −(v) is the in neighborhood of v (i.e., nodes that have an edge pointing to v), w u→v is the weight of the directed edge (u,v), and d +(u) is the sum of the weights of all directed edges leaving u. The Pagerank may be calculated using an iterative algorithm until the values converge.
Another metric commonly used to rank nodes in a network is closeness which captures the distance from a node to all other nodes in the network. The idea is that nodes that are close to other play a more important role in the network. Despite having a few variations, the definition for closeness used in this paper is the following:
where d vu is the distance on the directed graph (ignoring weights) from v to u, V is the set of nodes in the network, and n=|V| is the number of nodes in the network. Note that if there is no path from v to u then d vu =∞ and thus 1/d vu =0. This definition is suited for networks that are not strongly connected and that have many connected components which is the case at hand.
Before computing the closeness value for each node in the lawyers’ network, we invert the direction of all edges. Recall that an edge from u to v indicates that v won a case against u. However, this does not make the distance from v to other nodes any shorter. Intuitively, more wins would lead to a node being closer to the other nodes. To capture this intuition, we invert the direction of all edges before computing the closeness value of the nodes.
Effectiveness of the rankings
In order to assess the effectiveness of the rankings, we will consider the effectiveness of the lawyers respect to their ability to win legal cases. For each lawyer, we consider the number of cases won and lost by that lawyer, giving a fraction of wins. Moreover, we consider the claim values of all cases won and lost by the lawyer, giving a fraction of claim values that have been won. An effective lawyer is one with a large fraction of wins or a large fraction of claim values won. However, note that claim values used here correspond to requested values and not the actual amount mandated by the sentence. Unfortunately, this last information is not readily available in the database used.
We start by considering the effectiveness of the rankings given by in and out strength, as shown in Table 2. The effectiveness of the top 10 lawyers according to in and out strength are given in Tables 3 and 4, respectively. As expected, the effectiveness of top 10 lawyers according to in strength is significantly better than the top 10 lawyers according to out strength. Only a single lawyer in the in strength ranking did not win 50% or more of its cases (both in number of cases and claim values), while none achieved this mark in the out strength ranking. Moreover, the top ranked lawyer according to in strength has won 89% of the cases (187) and the same fraction of claim values (5.3 million reais). And although the top ranked lawyer according to out strength has won a larger claim value (6.5 million reais), claims lost add up to a much larger value (23.4 million reais), indicating that the lawyer is not effective.
Another interesting observation in Tables 3 and 4 is that for most lawyers, the percentages of cases won are quite similar to percentages of claim values won. This is due to claim values having some standardized suggested values and the fact that fractions represent averages across many legal cases (over 100 for almost all lawyers in these rankings).
We now proceed to evaluate the effectiveness of the closeness metric, which is shown in Table 5. As with in strength, note that only one lawyer in the top 10 has won less than 50% percent of the cases (number and value). We also observe lawyers with very high claim values won (up to 10.3 million reais) and six lawyers winning over 200 cases. When considering the top 10, closeness was shown to be somewhat superior than in strength in identifying effective lawyers.
We now consider the effectiveness of the Pagerank metric to rank the lawyers’ network, as shown in Table 6. Surprisingly, the effectiveness of the top 10 lawyers is significantly lower than that identified by the in strength and closeness metrics, with six lawyers winning less than 50% of their cases (in number and claim value).
Although Pagerank is a well established and generally successful metric, it failed to capture the most effective lawyers of the network. One key reason is the fact that Pagerank does not take into consideration the out degree (or out weight) of the nodes, at least as a first order. However, this is quite crucial for our domain, as high out degree (or out weight) is an indication that the lawyer is not so effective. In order to capture this aspect, we consider the following metric to rank the nodes:
where P R(v) is the Pagerank value for node v (as previously defined) and Γ +(v) is the out neighborhood of node v. Note that this metric simply subtracts from the Pagerank value the out strenght of the node, penalizing nodes that have a large out strength. The effectiveness of this modified ranking metric is showing in Table 7. Note that the ranking is much superior than Pagerank alone (see Table 6). In particular, the less effective lawyer in the top 10 has won 70% of its cases (in number and claim values). This corroborates the intuition that Pagerank does not penalize vertices with large out degree (or out strength).
Last, we present a direct comparison between the different rankings, shown in Table 8. In addition to the three network metrics considered in this paper, we also show the ranking according to two simple metrics: number of legal cases won; total claim value across all cases won. Note that some lawyers appear in the top 10 ranking for all network metrics, such as 59 and 3117. However, only 59 appears in the top 10 of one of the simple metrics. Moreover, none of the top 8 lawyers in total claim value won appear in the top 10 of any of the network metrics. This indicates that network metrics can capture effects beyond simple statistics, potentially better assessing the effectiveness and influence of the lawyers. Moreover, since some lawyers appear in the top 10 of different network metrics (such as 59 and 3117), this suggests not only that these metrics are somewhat consistent in their effectiveness but that they can also capture influential lawyers.
In order to more objectively assess the quality of the network rankings, we evaluate the correlation between the ranking metric and two simple statistics, namely the number of cases won and the total claim value won. In particular, we consider the Spearman correlation coefficient between X(v) and Y(v), where X(v)={P R(v),C v ,in strength} and Y(v)={number of cases won by v,total claim value won by v}. Last, we consider the top 10, top 50, and all lawyers in the network when calculating the correlation coefficient, with results presented in Table 9. Note that vertex strength shows a high correlation with both number of cases and total claim value won, in particular for when all lawyers are considered. This is not surprising given that in strength is highly correlated with winning cases. Interestingly, closeness also shows a high correlation with both number of cases and total claim value. Intuitively, winning shortens distances as in edges are created, which could explain this correlation. Last, penalized Pagerank has a high correlation only when considering the top 50, for both simple statistics, but only marginal correlation for the other cases. But note that a high correlation does not necessarily indicate a better ranking of influence or important, in particular if influence or importance is not strongly correlated with the simple metrics, such as winning cases.
Qualitative analysis
In order to better assess the quality of the ranking produced by the various metrics, we conducted a qualitative analysis of some of the lawyers appearing in the top 10. For example, lawyer 59 appears in all top 10 rankings. His activities as a lawyer began in 1989 and he has defended workers in the cities of Rio de Janeiro, Niteroi, and Nova Iguaçu, having participated in a large number of cases (332 in total). Appearing in two top 10 rankings, lawyer 943 began his legal career in 1986 in a large firm in Rio de Janeiro. The firm expanded in 1994 and has extensive experience regarding labor law, providing advisory and consulting services to individuals and companies being specialized in conflict prevention and resolution and having assisted thousands of clients.
Although not appearing in all of the top 10 rankings, some identified lawyers are certainly influential. For example, lawyer 16604 has great prestige in the area of labor claims, having over 20 years experience since opening his own law firm in the 90s. He defends clients in various kind of cases across different courts in Brazil, showing his influence at the national level. Moreover, in 2015 he received the title of Honorary Citizen of the city of São Paulo. Another example is lawyer 15928 who works in one of the Brazil’s largest law firms. This law firm is recognized by analysts of the legal sector and by publications in this area, having won numerous awards in recent years, being one of the best Brazil law firms in 12 areas by the journal Analysis Advocacy 500 2015 [15] and one of the best Brazil law firms in 22 areas by Chambers Latin America 2016 [16].
Several other lawyers listed among the top 10 have years of experience in the field of labor law with most of them working for employees or worker’s unions. Clearly, ranking nodes in the lawyers’ network using different centrality metrics can reveal both effective lawyers (in terms of winning cases and claim values) and influential lawyers (in terms of recognized prestige in their field).
Conclusion
Various different networks can be represented from publicly available data and analysing their structure can lead to useful insights and important applications. This work considers thousands of legal cases in a specific labor court (in the state of Rio de Janeiro) and constructs a network of lawyers. The key idea in constructing the network is to capture relative importance among the lawyers, creating weighted edges from lawyers that lose to lawyers that won the case. An empirical analysis of the structure of this social network indicates that is has many common features with other real social networks, such as short distances and heavy-tailed distribution for edge weights and node degree.
Beyond characterizing the network structure, we propose and evaluate different network metrics to rank the lawyers. The key idea is that by exploring the network structure induced by winning and losing legal cases we can better identify effective and influential lawyers, much beyond using simple statistics, such as the number of legal cases won or the total claim value won. An analysis of the effectiveness of the lawyers in the top 10 ranking of different metrics indicates that the the network structure can indeed be used to identify effective and influential lawyers. Surprisingly, the classic Pagerank centrality metric failed to identify effective lawyers but a penalized variation compensate for nodes with large out strength proposed here showed better performance. The quantitative analysis indicated that network metric rankings consistently identify lawyers that are not in the top rank of simple statistics, showing the potential of a network-based analysis. The qualitative analysis also revealed that some lawyers identified by the centrality metrics are quite influential in their field and many have a large experience in the practice of labor law. Thus, clearly the lawyers’ network encodes a great deal of information that can be used to reveal important aspects of the domain, including the effectiveness of lawyers and their relative importance.
Endnotes
1 Labor Court’s Electronic Judicial System
2 Accessible through http://www.trt1.jus.br
3 Available at https://graph-tool.skewed.de/
4 Available at http://matplotlib.org/
Abbreviations
- ATP:
-
Association of Tennis Professional
- CCDF:
-
Complementary cumulative distribution function
- CLT:
-
Consolidation of Labor Laws
- CNJ:
-
National Council of Justice
- CNPq:
-
National Council for Scientific and Technological Development
- CSJT:
-
Superior Council of Labor Justice
- FAPERJ:
-
Research Funding Agency for the State of Rio de Janeiro
- PJe-JT:
-
Electronic Legal Case in Labor Justice
- TRT1:
-
Regional Labor Court - 1st Region
- TST:
-
Superior Labor Court
References
Newman MEJ (2004) Who is the best connected scientist? A study of scientific coauthorship networks. In: Ben-Naim E, Frauenfelder H, Toroczkai Z (eds)Complex Networks, 337–370.. Springer, Berlin.
Radicchi F (2011) Who is the best player ever? A complex network analysis of the history of professional tennis. PLoS ONE 6(2): 17249.
Herminia Ibarra SBA (1993) Power, social influence, and sense making: effects of network centrality and proximity on employee perceptions. Adm Sci Q 38(2): 277–303.
Júnior PSP, Gonćalves MA, Laender AHF, Salles T, Figueiredo D (2012) Time-aware ranking in sport social networks. J Inf Data Manag 3(3): 195–209.
Newman MEJ (2001) The structure of scientific collaboration networks. Proc Natl Acad Sci 98(2): 404–409.
Fowler JH, Johnson TR, Spriggs JF, Jeon S, Wahlbeck PJ (2007) Network analysis and the law: Measuring the legal importance of precedents at the US Supreme Court. Political Analysis: 324–346. JSTOR.
Bursztyn VS, Nunes MG, Figueiredo DR (2016) How congressmen connect: analyzing voting and donation networks in the brazilian congress In: 5th Brazilian Workshop on Social Network Analysis and Mining.. SBC, Porto Alegre.
Rodrigues Ribeiro LF, Figueiredo DR, Nascimento PR (2016) Análise e Ranqueamento da Rede de Advogados induzida por Processos Judiciais Trabalhistas In: 5th Brazilian Workshop on Social Network Analysis and Mining.. SBC, Porto Alegre.
de Azevedo PR, Pedroza KVBProcedimento Sumaríssimo: aspectos polêmicos. http://www.webartigos.com/artigos/procedimento-sumarissimo-trabalhista-aspectos-polemicos/90877/. Accessed 11 Mar 2016.
Lopes JTermos Judiciais. http://www.jocelialopesadvocacia.com.br/termos.html. Accessed 16 Dec 2015.
de Justiça CNResolução N° 125 de 29/11/2010. http://www.cnj.jus.br/busca-atos-adm?documento=2579. Accessed 11 Mar 2016.
Figueiredo DR (2011) Introdução a redes complexas. In: de Souza AF Meira Jr. W (eds)Atualizações em Informática 2011, 303–358.. PUC-Rio, RJ.
Barrat A, Barthélemy M, Pastor-Satorras R, Vespignani A (2004) The architecture of complex weighted networks. Proc Natl Acad Sci 101: 3747–3752.
Page L, Brin S, Motwani R, Winograd T (1999) The pagerank citation ranking: Bringing order to the web. Technical Report 1999-66, Previous number = SIDL-WP-1999-0120.
Editora AAdvocacia 500 - 2014. http://www.analise.com/site/publicacoes/exibe/2/analise-advocacia-500. Accessed 16 Dec 2015.
Chambers, PartnersChambers Latin America 2016. http://www.chambersandpartners.com/guide/latin-america/9. Accessed 18 Mar 2016.
Acknowledgements
The authors would like to thank Regional Labor Court - 1st Region (TRT1) for the facilitated access to data concerning legal cases (used in this work).
Funding
This work received financial support of research grants from FAPERJ and CNPq.
Authors’ contributions
LRR and DRF developed the concepts and the methods presented in this paper. LRR was responsible for collecting and analyzing the data as well as writing the necessary code and generating the figures, tables, and diagrams. DRF was responsible for supervising the work as well as structuring the manuscript and writing most of the text. Both authors read and approved the final version of this work.
Competing interests
The authors declare that they have no competing interests.
Authors’ information
Leonardo F. R. Ribeiro received a BS in Computer Engineering from the Federal Center for Technological Education of Minas Gerais (CEFET-MG), in 2014. He is currently a Master student at the Systems Engineering and Computer Science Program (PESC/COPPE) at Federal University of Rio de Janeiro (UFRJ) and works as a system analyst in the Regional Labor Court - 1st Region (TRT1) in Rio de Janeiro.
Daniel R. Figueiredo received a PhD degree in Computer Science from the University of Massachusetts Amherst (UMass) in 2005 after which he worked as a post-doc researcher at the Swiss Federal Institute of Technology, Lausanne (EPFL). In 2007, he joined the Department of Computer and Systems Engineering (PESC/COPPE) at the Federal University of Rio de Janeiro (UFRJ), Brazil as an associate professor. His main interests are in Network Science and in particular mathematical models for processes on dynamic networks.
Author information
Authors and Affiliations
Corresponding author
Rights and permissions
Open Access This article is distributed under the terms of the Creative Commons Attribution 4.0 International License (http://creativecommons.org/licenses/by/4.0/), which permits unrestricted use, distribution, and reproduction in any medium, provided you give appropriate credit to the original author(s) and the source, provide a link to the Creative Commons license, and indicate if changes were made.
About this article

Cite this article
Rodrigues Ribeiro, L.F., Figueiredo, D. Ranking lawyers using a social network induced by legal cases. J Braz Comput Soc 23, 6 (2017). https://doi.org/10.1186/s13173-017-0054-y
Received:
Accepted:
Published:
DOI: https://doi.org/10.1186/s13173-017-0054-y